
Figure 4.
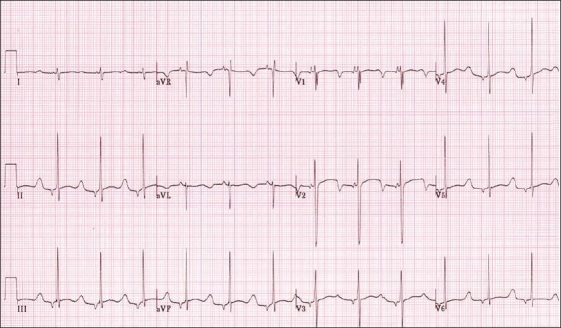
Surface ECG showing prolonged QTc with an isoelectric ST segment and peaked T waves seen in LQT3, also shows a low atrial rhythm
Official websites use .gov
A
.gov website belongs to an official
government organization in the United States.
Secure .gov websites use HTTPS
A lock (
) or https:// means you've safely
connected to the .gov website. Share sensitive
information only on official, secure websites.
Surface ECG showing prolonged QTc with an isoelectric ST segment and peaked T waves seen in LQT3, also shows a low atrial rhythm