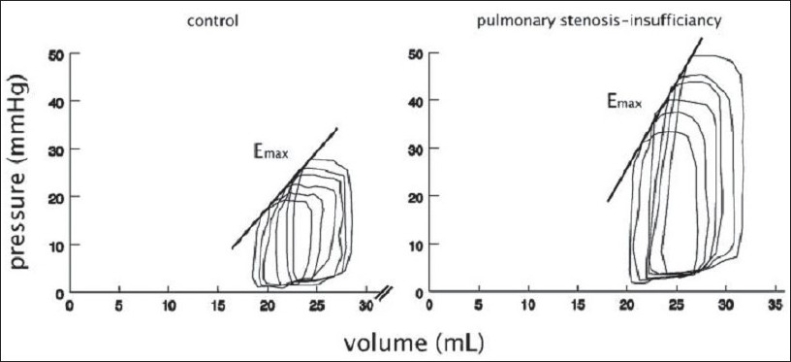
Figure 2.

Representative right ventricular pressure-volume loop of a pig with combined pulmonary stenosis and insufficiency and a control animal (measured at rest) at 3 month follow-up. Emax, slope of end-diastolic pressure-volume relation. (from Kuehne et al, 2005, used by permission)
