
. 2008 Jan-Apr;14(1):1–6. doi: 10.4103/0971-6866.42319
© Indian Journal of Human Genetics
This is an open-access article distributed under the terms of the Creative Commons Attribution License, which permits unrestricted use, distribution, and reproduction in any medium, provided the original work is properly cited.
Figure 1.
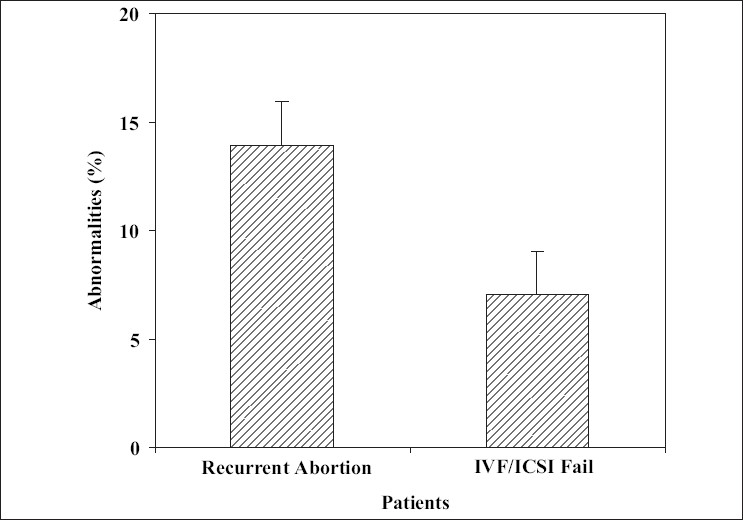
The abnormality rate in different study groups