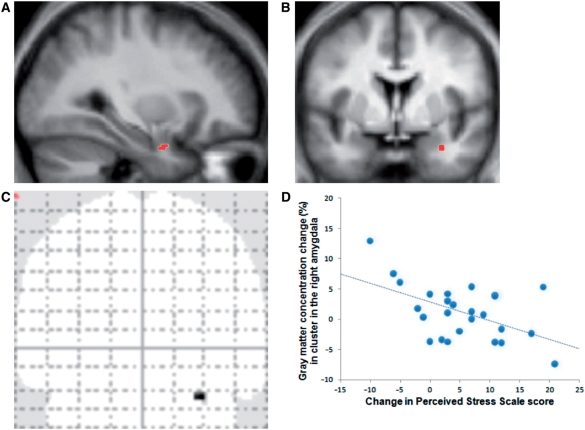
Fig. 1.
(A–C) Location of positive correlation between gray matter density change in right amygdala and change in PSS score. Identified cluster overlaid on group-averaged sagittal (A) (x = 32) and coronal (B) (y = 0) structural image. (C) The coronal glass brain image illustrates that no other brain regions were correlated even at a liberal statistical threshold of uncorrected P < 0.01. (D) Average percent change (post-intervention minus pre-intervention) in gray matter density within the identified cluster extracted from each individual plotted against change in PSS scores. For illustrative purposes, voxel values within the identified cluster in the right amygdala were extracted and averaged using Marsbar (Brett et al., 2002), and values on the x-axis were reversed.

