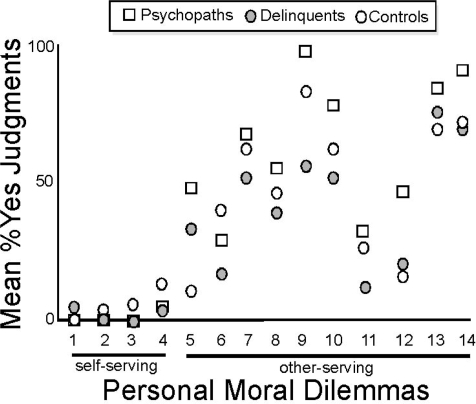
Fig. 2.
Scatterplot of subjects’ judgments (mean proportion of Yes responses) for all personal moral dilemmas, divided into self-serving (far left, first three cases) and other-serving (right, 11 cases) vignettes. Healthy controls are indicated by white circles, non-psychopathic delinquents by gray circles, and psychopaths by hashed squares.

