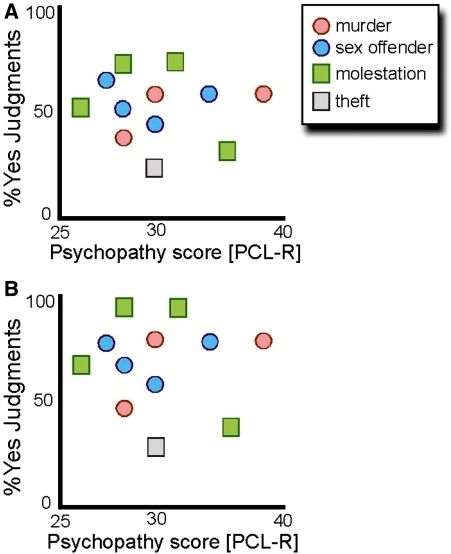
Fig. 4.
(A) Scatterplot of psychopathy scores (PCL-R; N = 12*) grouped by type of crime, against the proportion of yes judgments for all personal moral dilemmas. (B) Scatterplot of psychopathy scores (PCL-R; N = 12*) grouped by type of crime, against the proportion of yes judgments for the high conflict, other-serving personal moral dilemmas. *: For two individuals, crime files documented the administration of a PCL-R interview. However, these juridical file records only described these subjects as being a psychopath without mentioning the exact PCL-R score.

