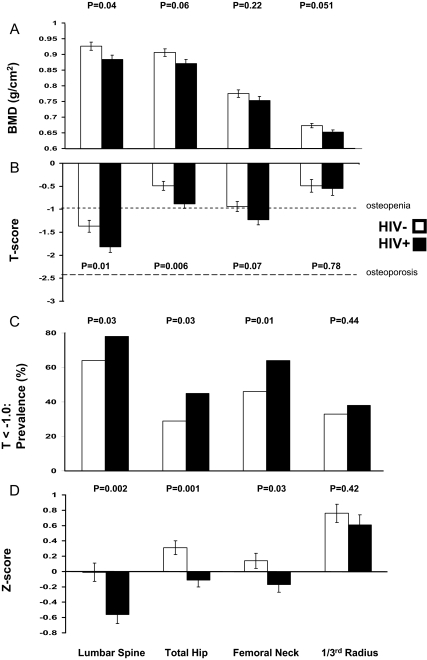
Figure 1.
A, Absolute BMD (grams per square centimeter) by DXA adjusted for age, race/ethnicity, and BMI in HIV− and HIV+ women. B, T scores by DXA in HIV− and HIV+ women. C, Prevalence of low BMD (T < −1.0) in HIV− and HIV+ women. D, Z scores adjusted for BMI in HIV− and HIV+ women. Adjusted comparisons of BMD at different sites are presented for HIV− (n = 95) and HIV+ (n = 92) postmenopausal minority women. In panel B, the dotted gray lines at T score = −1.0 and T score = −2.5 denote World Health Organization criteria for osteopenia and osteoporosis, respectively.

