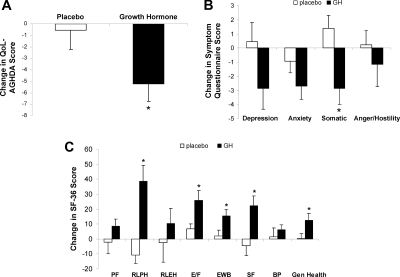
Figure 3.
Mean (±sem) change in the GH and placebo groups over 6 months in quality of life, as measured by the QOL-AGHDA (A), Symptom Questionnaire (B), and SF-36 (C). PF, Physical functioning; RLPH, role limitations due to physical health; RLEH, role limitations due to emotional health; MH, mental health; SF, social functioning; BP, bodily pain; Gen Health, general health. Higher scores reflect a poorer quality of life on the QOL-AGHDA and Symptom Questionnaire and a better quality of life on the SF-36. *, P < 0.05 vs. placebo-treated study subjects.

