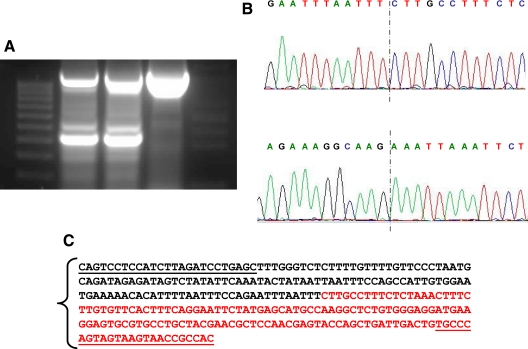
Figure 2.
A, Agarose electrophoresis showing the PCR of the deleted region (294 bp) and the internal PCR control. The first lane corresponds to the weight marker; lane 2, PCR amplification of genomic DNA of the patient; lane 3, PCR amplification of genomic DNA of the mother; lane 4, PCR amplification of genomic DNA of the father. The loss of the region at GNAS locus in the patient and her mother is evident. B, Sequencing of the deletion, with the sense sequence on the top and the reverse on the bottom with the dotted line marking the point where deletion occurred. C, Plain text of the sequence with the used primers underlined. In black is represented the upstream sequence and in red the downstream one.

