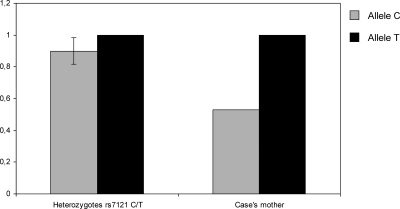
Figure 3.
Results of allele dosage analyses for the rs7121 SNP. The height of the columns represents the dosage of the respective allele in the genomic DNA for the patient and the mean of the controls (sd is included for allele C because data were normalized for allele T). Diminished dosage is observed for the patient’s allele C. Data are representative of two independent experiments with similar results.

