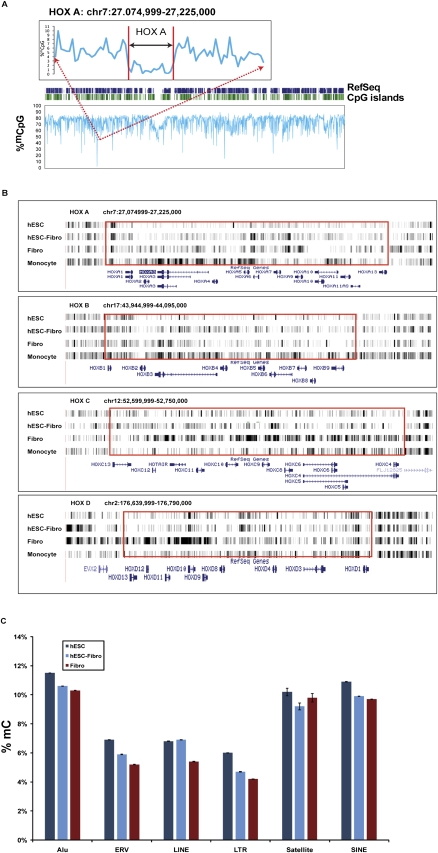
Figure 3.
(A) Methylation profile of chromosome 7 in hESC sample. (Dark blue bars) The positions of RefSeq genes; (green bars) the positions of CpG islands; (light blue trace) CpG methylation. The region surrounding the HOXA locus is expanded to show the level of hypomethylation. (B) The differential methylation profiles in relation to differentiation within the clusters of four HOX loci. Overall DNA methylation intensity of these clusters was the lowest in hESC and highest in monocytes and Fibro cells. (C) Percent total cytosine methylation for genomic repeat elements. Error bars, SD. The types of repeat elements shown are Alu, ERV, LINE, LTR, microsatellite, and SINE. Comparison of methylation levels of hESC, hESC-Fibro, and Fibro cell lines shows lower methylation in more differentiated cells for all of these types of repeat elements except microsatellites.

