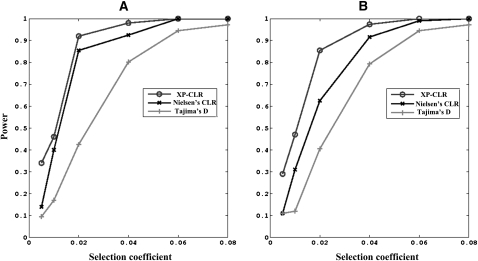
Figure 4.
The proportions of significant results for three tests of selection, as assessed by simulations for recent sweeps (A) and ancient sweeps (B). (XP-CLR) the method developed in this study; (Tajima D) Tajima's D test on the data from the object population; (Nielsen CLR) the method developed by Nielsen et al. (2005). Simulations were carried out with constant population sizes of 10,000 and population divergence time of 3000 generations with the code p2S (detailed in Methods). The false-positive rate is chosen to be 0.01. “Ancient” refers to the scenarios in which selection stops at 1000 generations ago; “recent” refers to selection stopping at the current generation.

