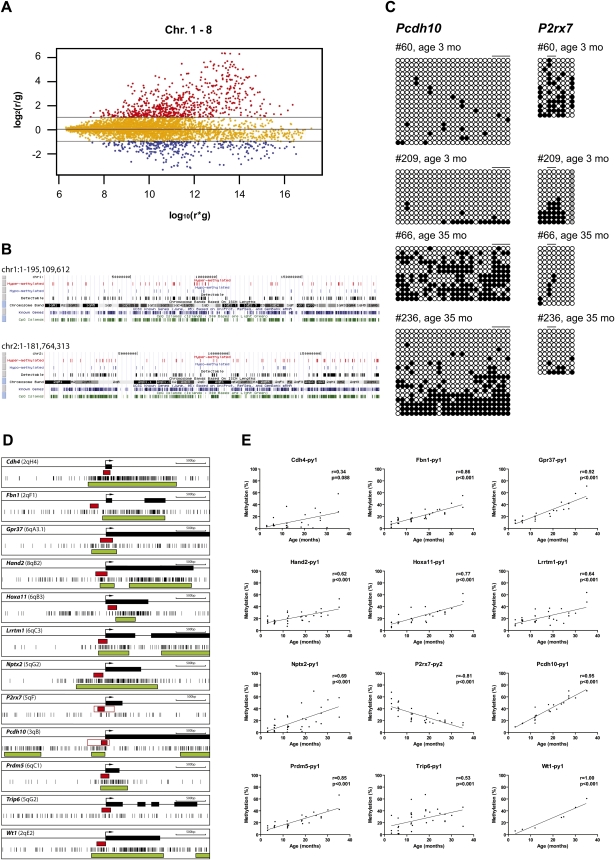
Figure 2.
MCAM analysis of age-related methylation. (A) R–I plot of the significant probes with FDR at 5% and fold change greater than two for MCAM. An R–I plot displays the log2(R/G) ratio for each element on the array as a function of the log10(R × G) product intensities and can reveal systematic intensity-dependent effects in the measured log2 (ratio) values. The red and blue spots indicate probes hypermethylated and hypomethylated in aged small intestine, respectively. (B) Chromosomal regions of age-related methylation. (Black vertical bars) Detectable regions by MCAM (DNA fragments < 2 kb); (blue vertical bars) regions showing hypomethylation with age (ratio < 2.0); (red vertical bars) regions showing hypermethylation with age (ratio > 2.0). (C) Bisulfite sequencing analysis in small intestine. Methylation profiles of Pcdh10 and P2rx7 in young and old small intestines. Each circle represents an individual CpG dinucleotide. (Filled circles) Methylated CpG; (open circles) unmethylated CpG; (gray circles) incomplete sequence. Orders of CpGs follow the direction of genomic DNA sequence shown in Fig. 1A. The drawing is not to scale. Each block of lines represents methylation data from sequencing of cloned PCR products. Each single line indicates the methylation profile detected by direct sequencing analysis from one clone. Horizontal bars represent the CpG sites used for pyrosequencing analysis. (D) Gene structure and CpG sites analyzed. Maps represent 3.5 kb of sequence around CpG islands (green boxes) and exons (black boxes) of genes analyzed in this study. Short vertical bars represent CpG sites. Arrows point to transcriptional start sites. Red boxes represent amplified regions for pyrosequencing. (E) Association of the percentages of methylated cytosines in the samples as obtained from pyrosequencing (y-axis) with age (x-axis) for 12 genes. The Spearman test was used to determine correlations, with significance set at P < 0.05. R represents a measure of the linear relationship between two variables, and varies from −1 to +1.

