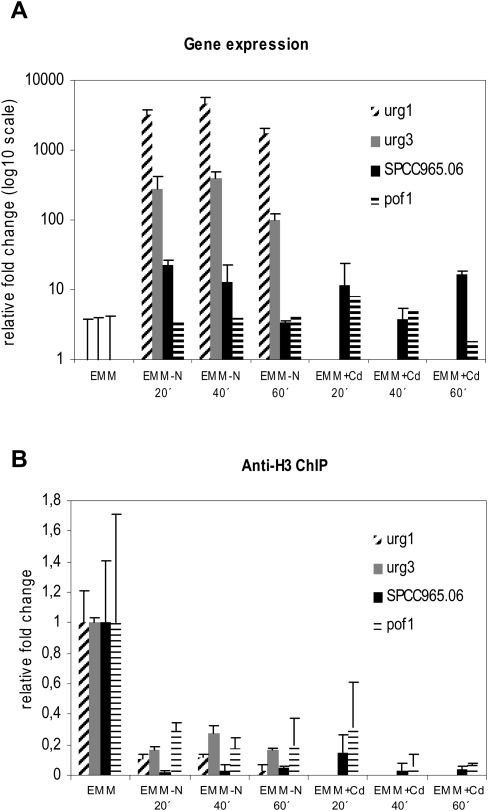
Figure 5.
Gene expression and nucleosome occupancy at different time points after nitrogen depletion and treatment with Cd2+. Cells were grown in EMM and starved for nitrogen or treated with 0.5 mM CdSO4, and samples were taken out for RNA preparation or ChIP at time points indicated. (A) Gene expression monitored by real-time PCR and normalized to expression of dis2+ and to the signal obtained for EMM media. Data are represented as mean + SD. (B) ChIP analysis of H3 association with the open reading frame of indicated genes measured by real-time PCR. Data were normalized to the input (nonimmunoprecipitated) material and the signal obtained for EMM media. Data are represented as mean + SD.

