
Figure 3.
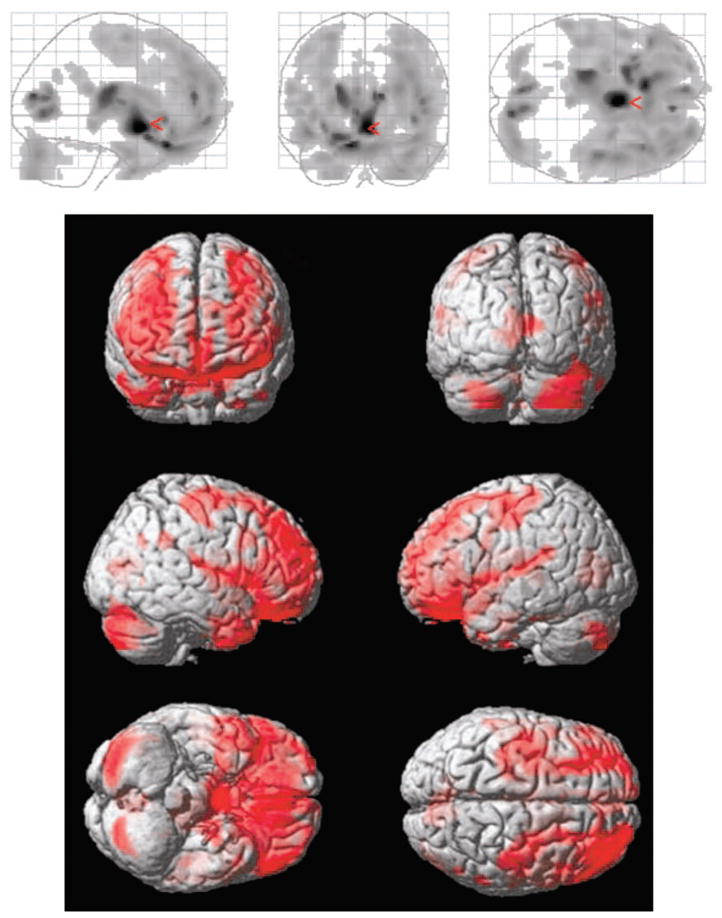
Regional brain abnormalities following traumatic brain injury in children. Results are based on voxel-based morphometry analyses through use of statistical parametric mapping (SPM) techniques. Participants were 6 adolescents (mean age = 16 years, SD = 5.1), all with severe TBI (i.e., Glasgow Coma Scale scores of 8 or below) and associated frontal and temporal contusions, compared with 18 control subjects of similar age (3 control subjects per TBI patient within 2 years of age). The gray scale SPM plots at the top of the figure illustrate significant differences (p < .001) between TBI patients and controls. Darker shading represents areas with less density of gray matter pixels (i.e., greater atrophy) within a given voxel among TBI subjects as compared with controls. The red arrow points to where the most significant changes were observed. In the colored three-dimensional portrayal in the bottom portion of the figure, the areas in red represent the regions where significant differences were found in the density of gray matter pixels within the comparison voxels. Adapted, with permission, from “Structural Imaging” by E. D. Bigler, in Textbook of Traumatic Brain Injury (2nd ed.), 2005, Washington, DC: American Psychiatric Publishing. Copyright 2005 by American Psychiatric Publishing.