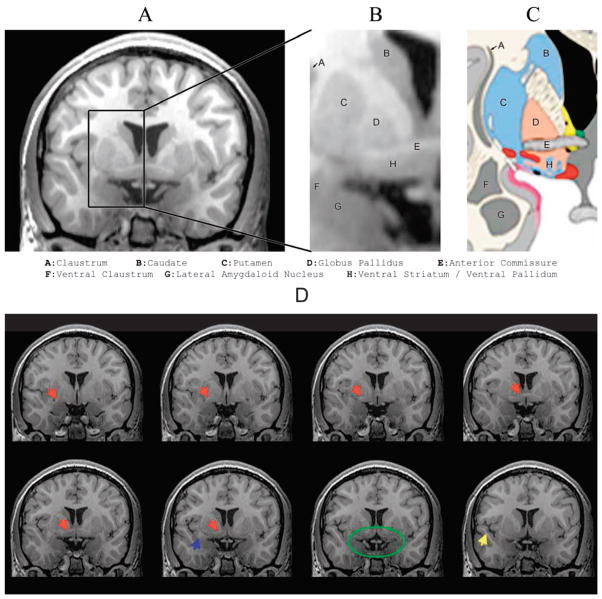
Figure 4.
Proximity of basal ganglia, ventral striatum, and amygdala. Panel A depicts a coronal thin section (1 mm) 3 Tesla MRI (T1 inversion recovery sequence) at the level of the basal ganglia and amygdaloid complex also showing location of the superior temporal gyrus (STG; Panel D, bottom row, blue arrow). The highlighted region shown in the box is enlarged in Panel B and labeled according to Heimer’s (2003) classification system, as shown in Panel C. The coronal sections in the bottom two rows of Panel D are 1 mm apart, with the section in Panel A shown in the outline in the bottom row of Panel D (green oval). The blue arrow identifies the STG, which can be viewed in each subsequent coronal section, and the yellow arrow identifies the temporal stem. Red arrows show the position of the anterior commissure, and the green oval outlines the region of the ventral striatum, parahippocampal gyrus, and amygdala. Adapted, with permission, from “The Limbic Lobe and Its Output Channels: Implications for Emotional Functions and Adaptive Behavior,” by L. Heimer and G. W. Van Hoesen, 2006, Neuroscience and Biobehavioral Reviews, 30, p. 128. Copyright 2006 by Elsevier.

