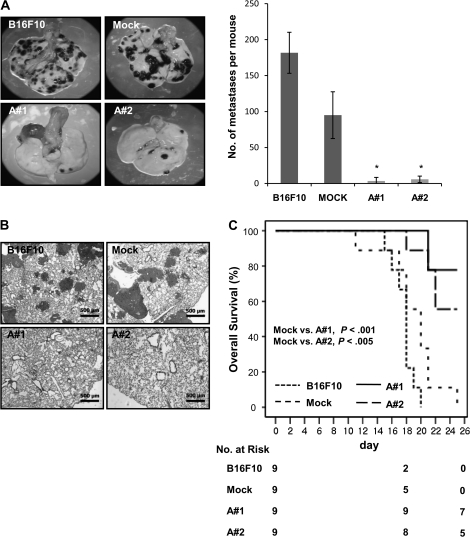
Figure 4.
Effect of mARD1A225 on lung nodule formation in mice. A and B) C57BL/6 mice were injected intravenously with B16F10, B16F10-mock, or B16F10-mARD1A225 cells. The incidence of lung nodules was determined 19 days after injection (n = 8 per group). A) Representative images of lungs (left). Numbers of surface tumor nodules (right). Results are means and 95% confidence intervals (CIs) (error bars) of two independent experiments performed with four mice per group. *P = .006, compared with the number of surface tumor nodules detected in B16F10-mock–injected mice, as determined with the two-sided Mann–Whitney U test. B) Hematoxylin and eosin staining of 4-μm lung tissue sections excised from mice described in (A). Magnification ×50. Scale bar = 500 μm. C) Kaplan–Meier survival plot of C57BL/6 mice injected with B16F10 (mean = 16.7 days, 95% CI = 15.7 to 17.7), B16F10-mock (mean = 18 days, 95% CI = 15.5 to 20.5), or B16F10-mARD1A225 cells (A#1, mean = 23.9 days, 95% CI = 22.5 to 25.3; A#2, mean = 22.7 days, 95% CI = 20.8 to 24.5) (n = 9 per group). Comparisons were made with log-rank tests. All statistical tests were two-sided.

