Figure 8.
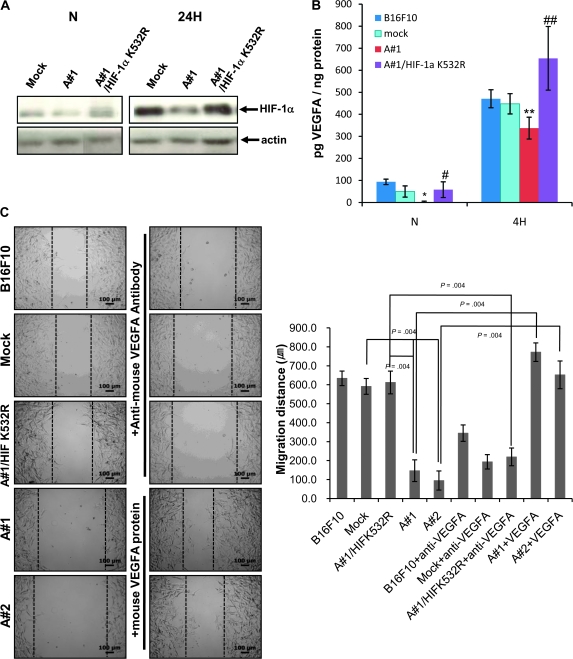
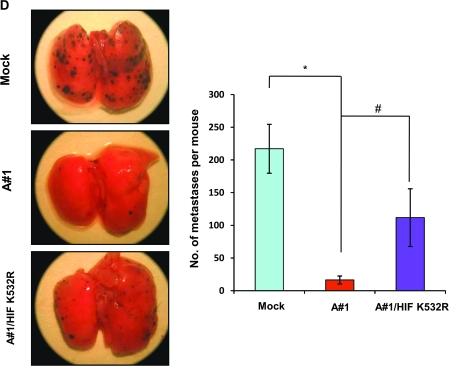
Effects of lysine 532 mutation in HIF-1α. A) HIF-1α protein levels were determined by Western blot analysis. B16F10-mock, B16F10-mARD1A225, and B16F10-mARD1A225-HIF-1α/K532R cells were cultured in the absence (N) or presence of 200 μM CoCl2 for 24 hours (24H). Similar results were obtained with three independent experiments. B) VEGFA levels (in picograms per milliliter) were quantified using enzyme-linked immunosorbent assay. B16F10, B16F10-mock, B16F10-mARD1A225, and B16F10-mARD1A225-HIF-1α/K532R cells were cultured in the absence (N) or presence of 200 μM CoCl2 for 4 hours (4H). Three independent experiments were performed, each in two replicates. Results are means and 95% confidence intervals (error bars) derived from the means of the individual experiments (n = 3). *P = .05 for all comparisons as determined with the two-sided Mann–Whitney U test. C) B16F10, B16F10-mock, B16F10-mARD1A225, and B16F10-mARD1A225-HIF-1α/K532R cells were grown to 80% confluence. A linear injury line was created at the center of the cultured monolayer by scraping with a sterile pipette tip. Cells were incubated in the presence of 200 μM CoCl2 for 24 hours. B16F10, B16F10-mock, and B16F10-mARD1A225-HIF-1α/K532R cells were treated with 3 μg/mL anti-mouse VEGFA antibody. B16F10-mARD1A225 cells were treated with 25 ng/mL recombinant mouse VEGFA protein. Images of cell migration (left). Quantification of cell migration (right). Migration distance (in micrometers); P = .004, determined with the two-sided Mann–Whitney U test. Three independent experiments were performed, each in two replicates. Results are means and 95% confidence intervals (error bars) derived from the means of the individual experiments (n = 3). Magnification ×100. Scale bar = 100 μm. D) C57BL/6 mice were injected intravenously with B16F10-mock (n = 40 mice), B16F10-mARD1A225 (n = 31 mice) and B16F10-mARD1A225-HIF-1α/K532R cells (n = 11 mice). Lung nodule formation was determined 14 days after injection. Representative gross images of lungs are shown (left). Numbers of surface tumor nodules per mouse (right). Results are means and 95% confidence intervals (error bars). *P < .001, compared with the number of surface tumor nodules in B16F10-mock–injected mice, #P < .001, compared with the number of surface tumor nodules in B16F10-mARD1A225–injected mice, as determined with the two-sided Mann–Whitney U test. A#1 = B16F10-mARD1A225 #1; A#2 = B16F10-mARD1A225 #2; A#1/HIF K532R = B16F10-mARD1A225 #1-HIF-1α/K532R; B16F10 + anti-VEGFA = B16F10 + anti-mouse VEGFA antibody; Mock + anti-VEGFA = B16F10-Mock + anti-mouse VEGFA antibody; A#1/HIF K532R + anti-VEGFA = B16F10-mARD1A225 #1-HIF-1α/K532R + anti-mouse VEGFA antibody; A#1+VEGFA = B16F10-mARD1A225 #1 + recombinant mouse VEGFA protein; A#2+VEGFA = B16F10-mARD1A225 #2 + recombinant mouse VEGFA protein.


