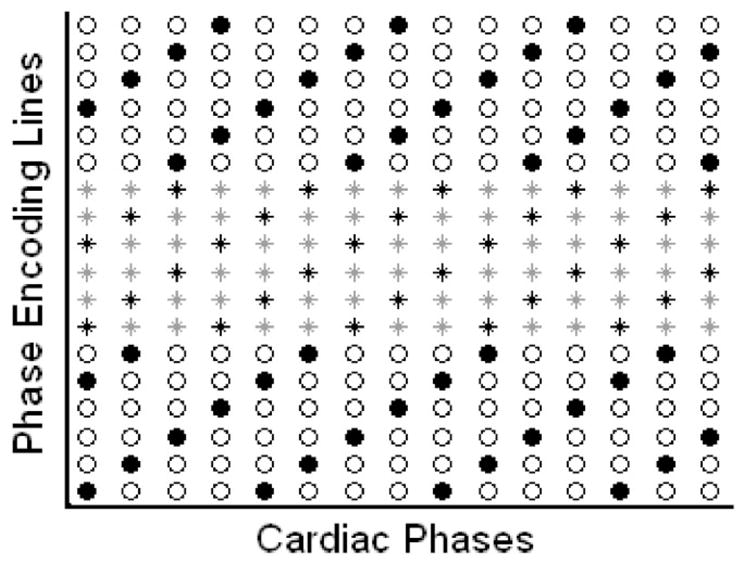
Figure 1.

The sampling pattern of k-t GRAPPA with an acceleration factor in outer k-space (AFO) of 4 and k-t2 GRAPPA with an AFO of 4 and an acceleration factor in center k-space (AFC) of 3. The column and the row indicate the phase-encoding direction and the temporal direction, respectively. The black dots represent the acquired outer k-space lines, whereas the circles represent the skipped k-space lines. Stars represent the ACS lines at center k-space. ACS lines were fully acquired for k-t GRAPPA, whereas only the ACS lines represented by black stars were acquired for k-t2 GRAPPA.
