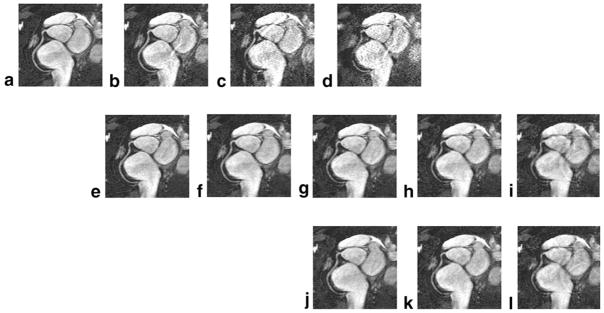
Figure 4.
The maximum-intensity-projection citation(MIP) images reconstructed using different methods: the reference image at mid-diastole (a), the corresponding GRAPPA images with acceleration factors in outer k-space (AFOs) of 2–4 (b–d), the k-t GRAPPA images with AFOs of 2~6 (e–i) and the k-t2 GRAPPA images with AFOs of 4–6 (j–l).

