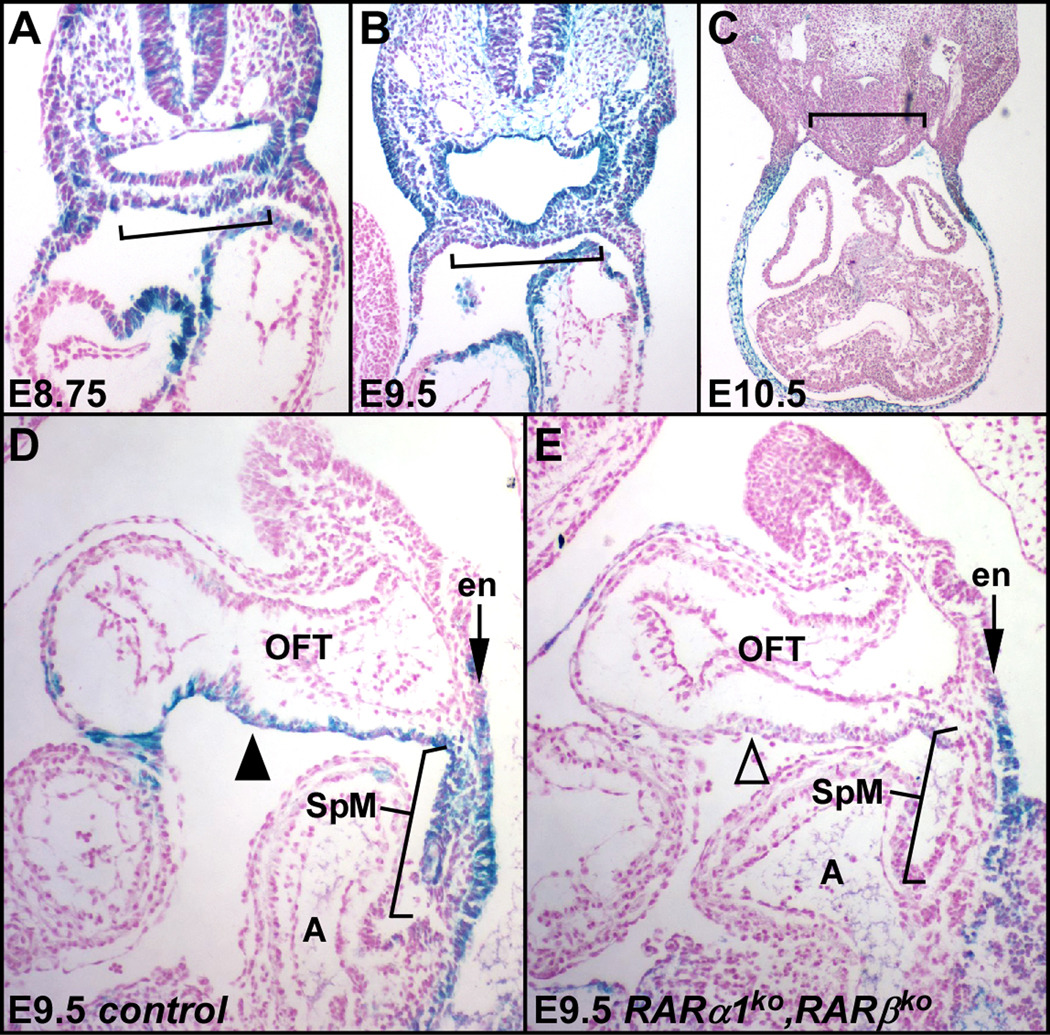
Fig. 1.
Visualization of endogenous RA response. A–C. Xgal stained sections of normal RARE-lacZ transgenic embryos are shown at E8.75, E9.5, and E10.5 in transverse section. D–E. Sagittal sections of control (D) and RARα1/RARβ mutant (E) littermate embryos at E9.5. Brackets indicate the splanchnic mesoderm (SpM). A, atria; en, endoderm; OFT, outflow tract; V, ventricle; arrowheads, OFT myocardium.

