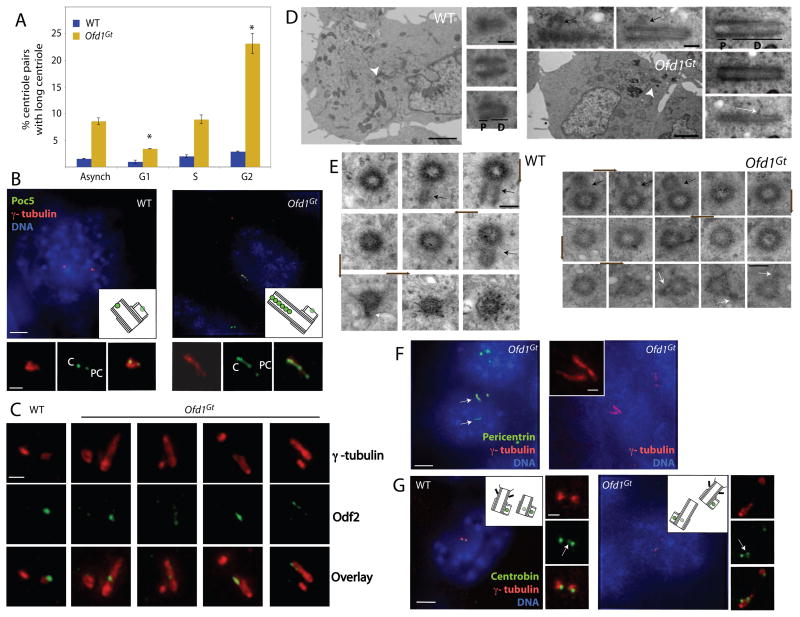
Figure 4. Ofd1 restrains growth of the distal domain of both mother and daughter centrioles in G2.
(A) Graph indicating the percent of long centrioles in WT and Ofd1Gt cells in different cell cycle phases. Asterisks indicate statistically significant differences compared to the asynchronous population (p < 0.01). (B) The distal centriole (Poc5), centrosomes (γ-tubulin), and DNA (DAPI) of WT and Ofd1Gt cells. Poc5 localizes more strongly to mother or daughter centrioles than to procentrioles. PC, procentriole. C, centriole. (C) Centriole appendages (Odf2) and centrosomes (γ-tubulin) of WT and Ofd1Gt cells. (D) Longitudinal and (E) transverse TEM sections of a WT and long Ofd1Gt centriole. Centriole proximal domain (P), distal domain (D), subdistal appendages (white arrows), procentrioles (black arrows). Arrowheads indicate centrioles in low magnification TEM images. Brown arrows show direction of section sequence. Normal length centrioles are contained within 8–10 sequential transverse sections, whereas long centrioles span more than 10 sections. (F) Ofd1Gt cells showing centrosomes (Pericentrin and γ-tubulin) and DNA (DAPI). (G) Daughter centrioles and procentrioles (Centrobin), centrosomes (γ-tubulin), and DNA (DAPI) of WT and Ofd1Gt cells. In S-G2 phase, Centrobin localizes more strongly to the procentrioles than to the daughter centriole. Arrows indicate daughter centrioles. Scale bars indicate 2 μm (TEM, low magnification), 200 nm (TEM, high magnification), 5 μm and 1 μm (inset). See also Figure S3.

