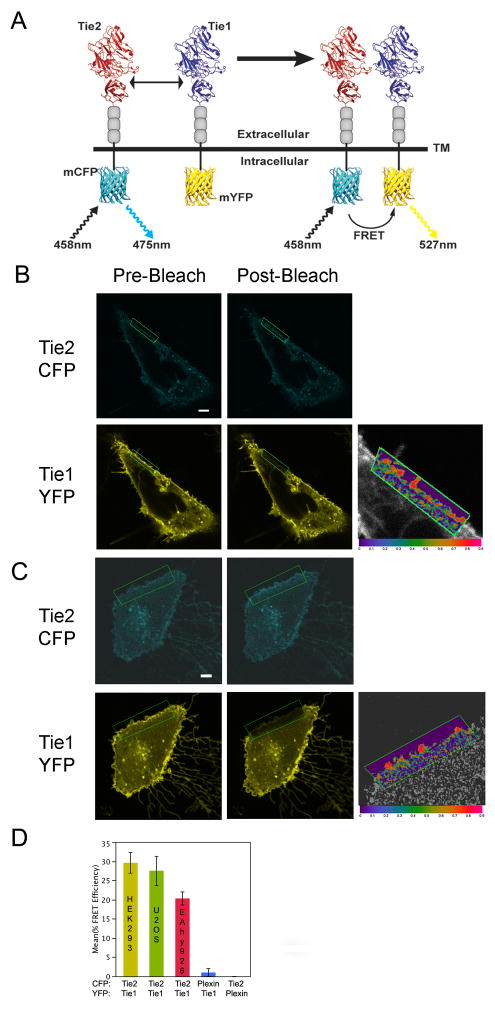
Figure 1. Association of Tie1 and Tie2 on the cell surface as analyzed by the FRET-based spatial proximity assay.
A) Schematic representation of the spatial proximity assay used to monitor Tie1-Tie2 interactions in vivo. Receptor association allows measurable FRET between CFP and YFP via confocal microscopy. Ligand dimerization is shown for simplicity. B–C) Tie1-YFP and Tie2-CFP co-expression and association in U2OS (B), and EA.hy 926 (C) cells (See also Figure S1 for co-expression and localization in HEK293 cells). The majority of the receptor-fluorophore fusion localizes predominantly to the plasma membrane (although a fraction is also observed in the secretory system). D) Graphical representation of average FRET values for wild-type Tie1 and Tie2, as well as control receptors (Control experiments were conducted in U2OS cells and displayed in Figure S2). Data are represented as mean +/− SEM. *For all images CFP will be displayed as cyan and YFP as yellow. Photobleaching experiments were restricted to, and FRET values calculated from, the region within the green box. Both pre- and post-photobleaching images are displayed as left and right panels, respectively. FRET efficiency is displayed as an absolute range from high (red-1.0) to low (purple-0.0) on a magnified overlay of a CFP/YFP merged image for orientation purposes only. Light gray bar in each image indicates 10 μm.

