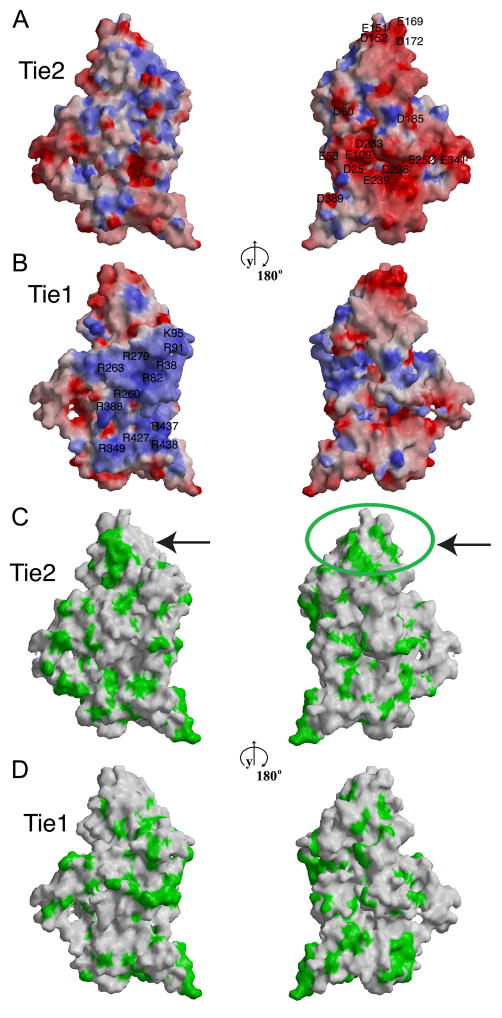
Figure 2. Comparison of the molecular surface properties of Tie2 and Tie1.
Molecular surface representation of Tie2 (A–C) and of the modeled Tie1 (B–D) structure color-coded according to electrostatic surface potential (A, B) or hydrophobicity (C, D). Red and blue represent electrostatic potentials in the range of −11 to +11 kBT, where kB is the Boltzman constant and T is the temperature (293 K). Green represents surface residues with hydrophobic side chains. The left and right panels are related by 180° rotation about the y-axis. Arrows point to the previously determined ligand-binding region within the tip of the second immunoglobulin domain in Tie2.

