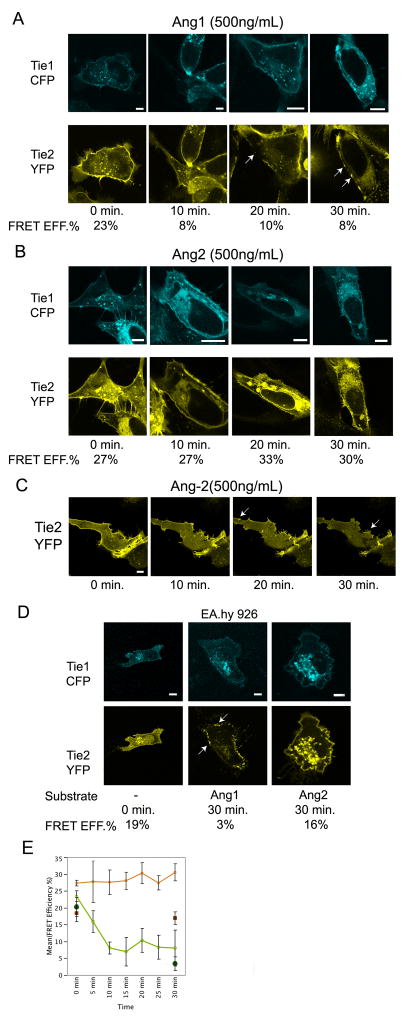
Figure 5. Ang-1, but not Ang-2, promotes Tie2 clustering and dissociation of Tie1-Tie2 complexes.
A–B) U2OS cells were transfected with both Tie2-YFP and Tie1-CFP and monitored by confocal microscopy over a period of 30 minutes. At time=0, either 500ng/ml of Ang-1 (panel A), or 500 ng/ml of Ang-2 (panel B) was added to the growth media. Listed below each representative image are averaged FRET values correlating to the listed time point. Arrowheads indicate regions of clustered Tie2. C) U2OS cells were singly transfected with Tie2-YFP and monitored by confocal microscopy over a period of 30 minutes following addition of 500 ng/ml of Ang-2 to the growth media. D) EA.hy 926 cells were transfected with both Tie2-YFP and Tie1-CFP and monitored by confocal microscopy over a period of 30 minutes. At time=0, either 500ng/ml of Ang-1 (middle panels), or 500 ng/ml of Ang-2 (right panels) was added to the growth media. Listed below each representative image are averaged FRET values correlating to the listed time point. E) The average FRET efficiencies from experiments in A, B, and C. Green and Orange lines represent Ang1, or Ang2 addition for U2OS cells, respectively, while closed Green circles and closed Orange squares represent Ang1, or Ang2 addition for EA.hy 926 cells, respectively. Data are represented as mean +/− SEM.

