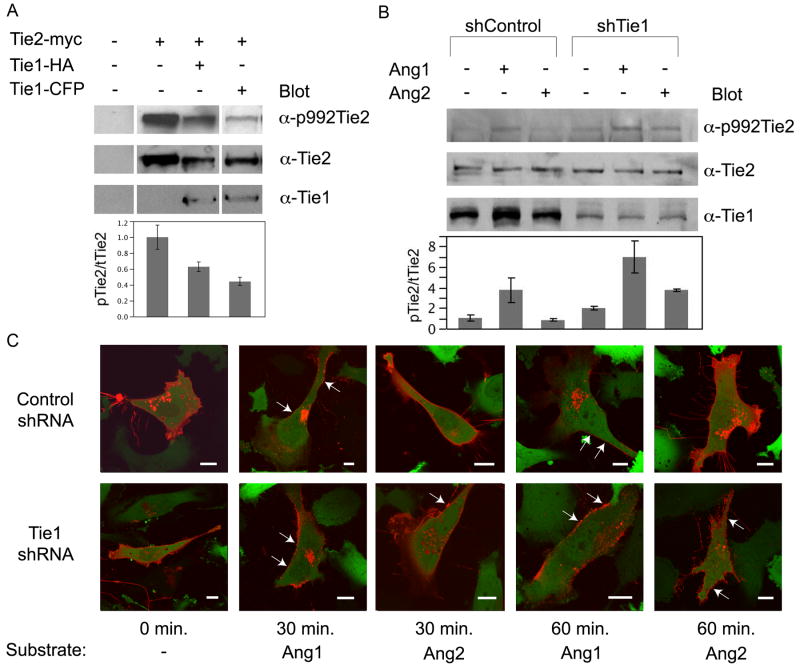
Figure 6. Tie1 is as an inhibitory co-receptor for Tie2.
A) HEK293 cells were transfected with full-length Tie2-myc alone or in combination with full-length Tie1-HA, or Tie1-CFP, harvested and lysates probed with anti-Tie1, anti-Tie2, and anti-phosphotyrosine 992 Tie2. The relative ratio of phosphorylated Tie2 (top panel) to total Tie2 (middle panel) was determined and the calculated value was arbitrarily set equal to 1.0 for Tie2 expressed alone. Values are graphically displayed below each respective lane. *Samples are from non-adjacent lanes of the same blot. B) Human umbilical vein endothelial cells were infected with an shRNA control or Tie1 knockdown lentivirus and selected with puromycin for stable integration (See Figure S3 for extent of Tie1 silencing). Asynchronous cultures were subjected to four hours of serum withdrawal, followed by stimulation with vehicle (buffer), 500ng/ml Angiopoietin-1, or 500ng/ml Angiopoietin-2. Fifteen minutes following addition of ligand, cells were harvested and subjected to western blotting with anti-Tie2 (middle panel), anti-Tie1 (bottom panel), and the phosphotyrosine specific anti-Tie2 (992) (top panel), as indicated. The relative ratio of phosphorylated Tie2 (top panel) over total Tie2 (middle panel) was determined and the calculated value was arbitrarily set equal to 1.0 for unstimulated Tie2 from shControl cells. Values are graphically displayed below each respective lane. C) Control (top panels) or Tie1 knockdown (bottom panels) stable EA.hy 926 cells were transiently transfected with full-length Tie2 fused to mCherry and imaged via confocal microscopy forty-eight hours post transfection. Cells were stimulated with Angiopoietin-1 or -2 and mCherry expression was followed over the course of sixty minutes. GFP expression (green) indicates stable viral integration and was overlaid onto mCherry (red) for orientation purposes. Arrows indicate areas of punctate Tie2 staining. Light gray bar in each image indicates 10 μm.

