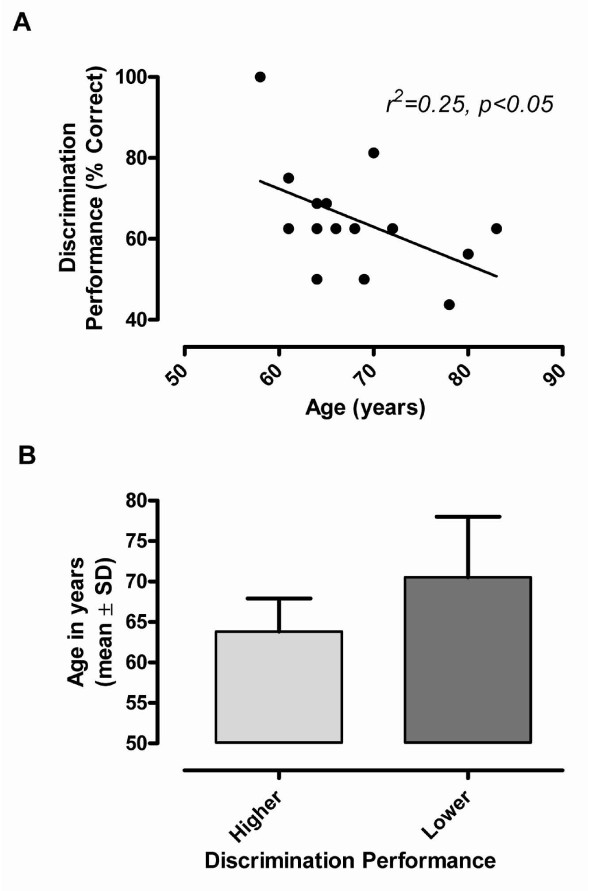
Figure 2.
Age and task performance. A. Scatterplot showing the inverse association between performance in the TD task and age (r value represents Pearson's correlation coefficient). B. Comparison of the mean age of participants after allocation to either a higher performance (≥ 69% correct, n = 6) or a lower performance group (<63% correct, n = 10). Note that individuals with higher discrimination performance were significantly younger (64 ± 4.1 yrs) than those (71 ± 7.5) with lower performance (t14 = 1.99, p = 0.03).

