
Figure 1.
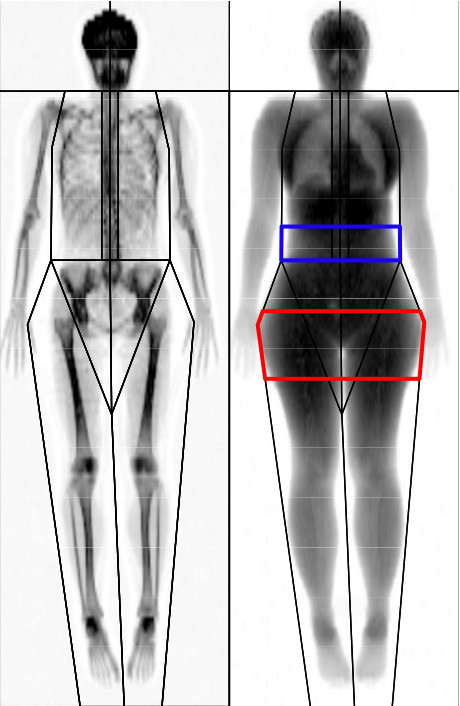
Typical full body DXA scan. The android region of interest (ROI) is highlighted in blue and the gynoid ROI is highlighted in red (refer to text for the landmarks that define these regions).
Official websites use .gov
A
.gov website belongs to an official
government organization in the United States.
Secure .gov websites use HTTPS
A lock (
) or https:// means you've safely
connected to the .gov website. Share sensitive
information only on official, secure websites.
Typical full body DXA scan. The android region of interest (ROI) is highlighted in blue and the gynoid ROI is highlighted in red (refer to text for the landmarks that define these regions).