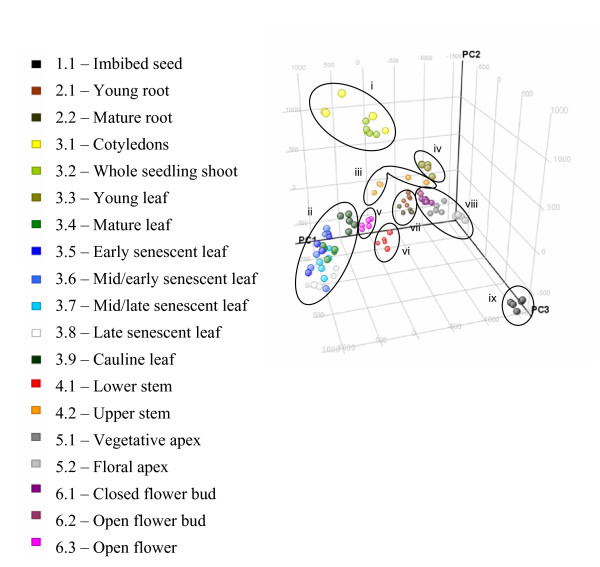
Figure 1.
Tobacco organ expression trends. Principal Components Analysis (PCA) of the microarray data for the 95 samples in TobEA. PCA is a statistical method that reduces the dimensionality of multidimensional data-sets and enables the variance in gene expression for microarray samples to be represented across a set of vectors. Data points representing individual MAS5 pre-processed tobacco microarray samples are plotted within the first three PC vectors. Samples occupying similar position in PC space share similar gene expression trends. Black oblongs in chart represent clusters of samples occupying similar position in PC space (see inset labels i to ix). Data points are coloured according to sample tissue of origin, with biological replicate samples coloured identically (see inset key for TTI identity).

