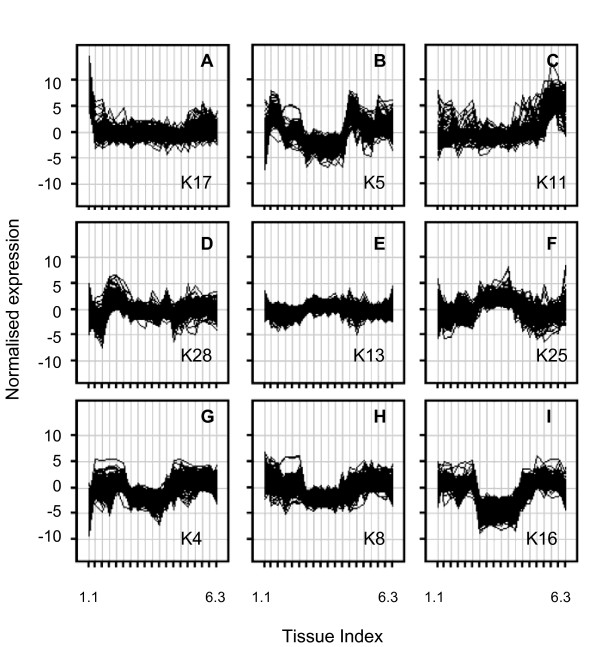
Figure 4.
Tobacco gene co-expression. 30009 genes identified as differentially expressed across the TobEA samples were K-means clustered into 30 groups of co-expressed genes. Panels show normalised gene expression levels (y-axis) plotted across all 19 TobEA tissue types (x-axis) for clusters K17 (A), K5 (B), K11 (C), K28 (D), K13 (E), K25 (F), K4 (G), K8 (H) and K16 (I). The full set of 30 clusters can be seen in Additional file 6: Tobacco gene co-expression.ppt.

