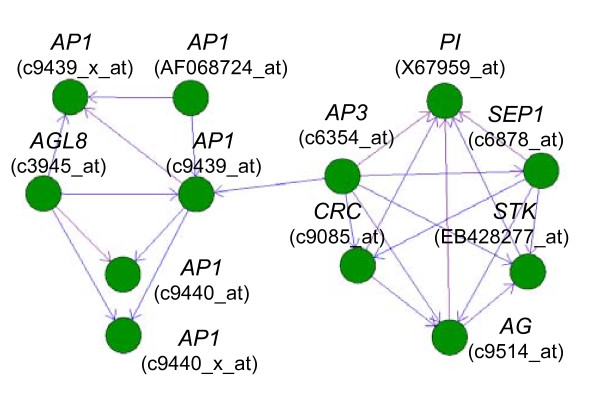
Figure 6.
Tobacco floral identity TF co-expression network. Expression data for the TOBFAC TFs present on the microarray was used to generate co-expression networks with Biolayout 3D [33]. Figure shows a representative gene network consisting of TFs involved in floral meristem determination and identity. Genes are represented by green nodes. Edges between nodes, indicating an interaction based on co-expression, are represented by arrows. Respective gene and probe names are given for each node.

