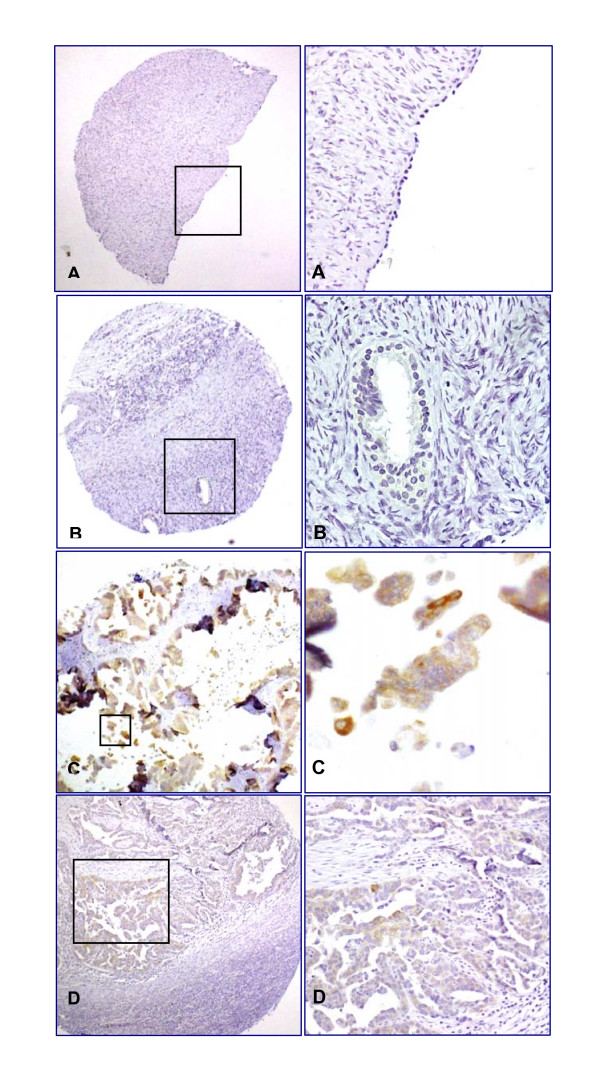
Figure 2.
Differential expression pattern of E2F5 in ovarian tumour specimens examined by immunohistochemistry. A, benign serous cystadenoma, B, epithelial inclusion cyst, C, cystic serous carcinoma, and D, endometrioid adenocarcinoma samples. The low power photomicrograph in each section shows the full tissue microarray "punch" (x100), while the high power photomicrograph shows detail of the antibody expression (x600). There is no E2F5 expression in normal and benign tissue (A, B), but significant expression in ovarian epithelial cancer (C, D).

