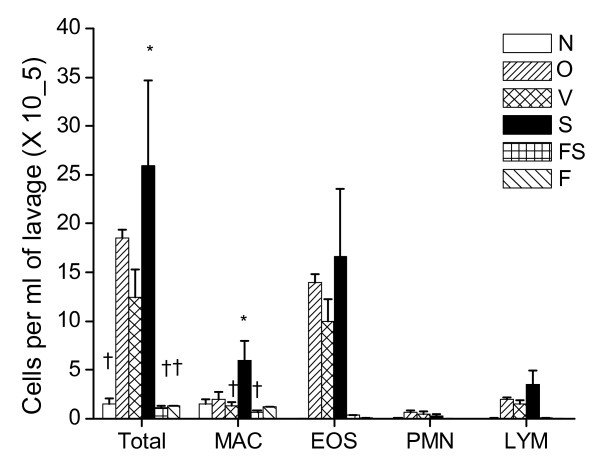
Figure 2.
BALF Cell Counts. Total cells (Total), macrophages (MAC), eosinophils (EOS), neutrophils (PMN), and lymphocytes (LYM). Treatment groups; Naïve mice (N), Inhaled OVA (6 doses) (O), OVA with vehicle control (V), salmeterol (S), fluticasone (F), and the combination (fluticasone and salmeterol) (FS). Mean cells per ml of BAL fluid ± SE. * in Total cells p < 0.05 for S compared to. N, FS, and F. † in Total cells p < 0.05 for N, F and FS compared to S. * in MAC p < 0.05 for S compared to V and FS. † in MAC p < 0.05 for V and FS compared to S.

