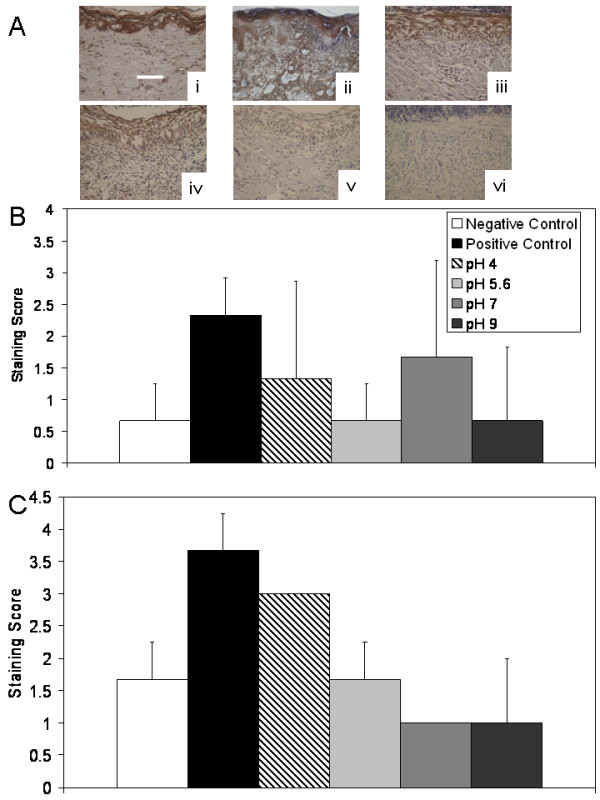
Figure 7.

Immunohistochemical detection of TNF-α in biopsies of DNCB-induced rashes treated with various nanocrystalline silver-derived solutions. (A) Representative images are shown for immunohistochemical detection of TNF-α after 72 h treatment of negative controls with distilled water (i), and DNCB-induced porcine contact dermatitis rashes with distilled water (positive controls) (ii), or nanocrystalline silver-derived solutions generated at starting pHs of 4 (iii), 5.6 (iv), 7 (v), or 9 (vi). The scale bar in A represents 100 μm. Staining for TNF-α appears brown, while the cell nuclei are counterstained purple using haematoxylin. Immunohistochemical staining scores for TNF-α are shown after 24 h (B) and 72 h (C) of treatment as described above. Statistical analyses, which were performed using one-way ANOVAs with Tukey-Kramer Multiple Comparisons post tests, are shown in Table 4. Error bars represent standard deviations.
