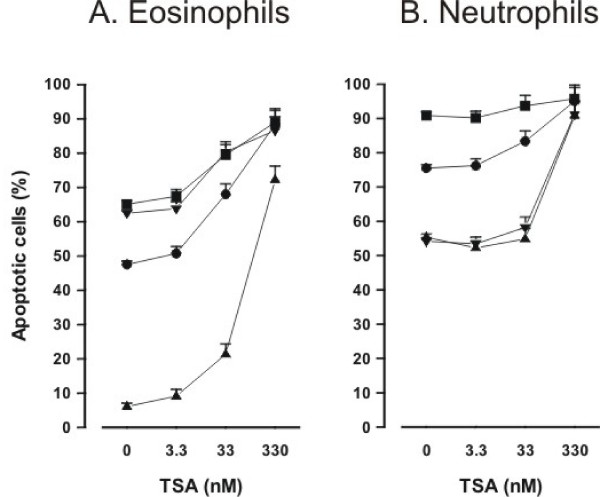
Figure 6.
Concentration-response curves of TSA in eosinophils (A) and neutrophils (B) in the absence (black circle) and presence of survival-prolonging cytokines (black up-pointing triangle; IL-5 0.3 ng/ml in eosinophils and GM-CSF 10 ng/ml in neutrophils), budesonide (black down-pointing triangle; 1 μM) or Fas (black square; 100 ng/ml). Apoptosis was assessed by flow cytometry measuring the relative DNA fragmentation (A) or Annexin V-binding (B). Eosinophils or neutrophils were isolated and concentration-response curves in the absence or presence of cytokines, budesonide or Fas were prepared simultaneously from the cells of the same donor. Mean ± S.E.M. of 6 independent determinations using cells from different donors.

