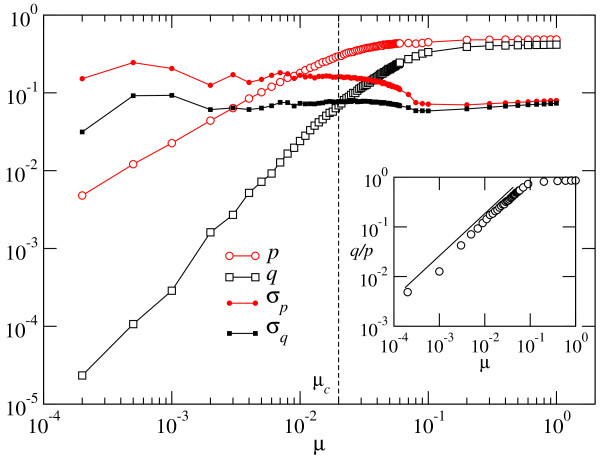
Figure 4.
Dependence of the phenotypic mutation fractions and of the average selective coefficients on the mutation rate μ - Optimized population. The phenotypic mutation fractions p and q increase monotonically as μ grows. Below the error threshold they behave as a power-law of μ, to a good approximation. The average selective coefficients σp and σq show little variation with μ. The inset shows the ratio between the fraction of beneficial and deleterious mutations. The straight line serves as a guide to the eye.

