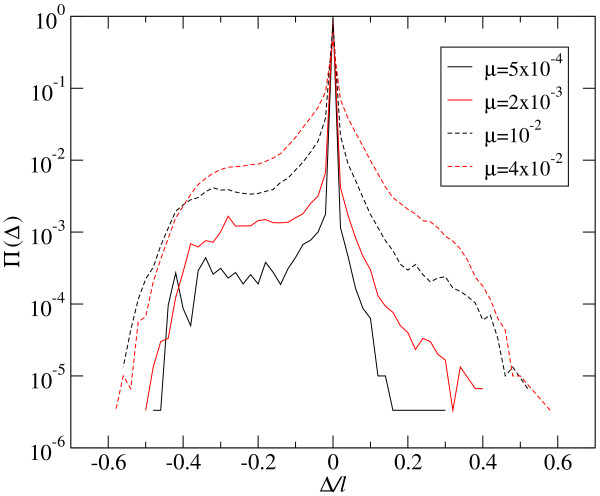
Figure 5.
Distribution of phenotypic changes - Adapting population. Four distributions Π(Δ) corresponding to different values of the mutation rate μ for adapting populations are shown. The probability distribution has been obtained by averaging over the first 50 generations in six independent runs for populations of size N = 1000. Compare these results with those shown in Figure 3.

