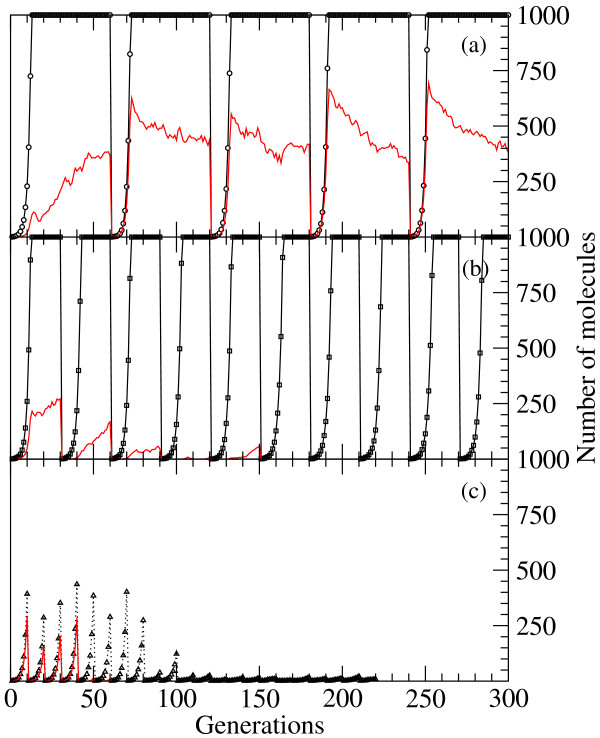
Figure 7.
Dynamics of a population subjected to regular bottlenecks. The frequency of application of extreme population bottlenecks, where a single molecule has to regenerate the whole population, threatens the long-term survivability of the ensemble. We show three representative simulations corresponding to (a) 40; (b) 25; and (c) 10 generations between consecutive bottlenecks. Open symbols in black represent the total number of sequences in the population; red curves stand for the total number of correctly folded sequences. Note the variable number of generations required for saturation of the population size in plots (a) and (b).

