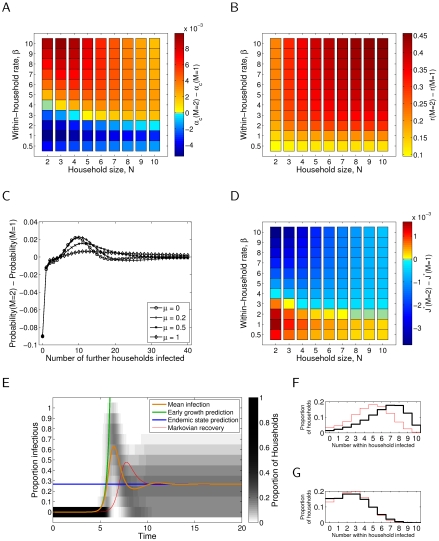
Figure 2. Epidemiological quantities as defined in the main text for the gamma ( ) infectious period distribution, compared to the exponential (
 ) results, where within household transmission rate parameter,
  , is held constant.
(A) Critical transmission difference  , with rate of waning immunity
  ;
;  . (B) Early growth rate difference
  , with rate of waning immunity
  and between-household transmission parameter
  ;
;  . (C) Offspring distribution difference, with within-household transmission rate parameter
  , house size
  and between-household transmission parameter
  ;
;  . (D) Endemic infection difference
  , with rate of waning immunity
  and between-household transmission parameter
  ;
;  . (E) Transient dynamics, with within-household transmission rate parameter
  , house size
  , rate of waning immunity
  and between-household transmission parameter
  ;
;  ; exponential (
 ) results are shown as a thin red line for comparison. (F) As in E at peak prevalence. (G) As in E at endemic prevalence.

