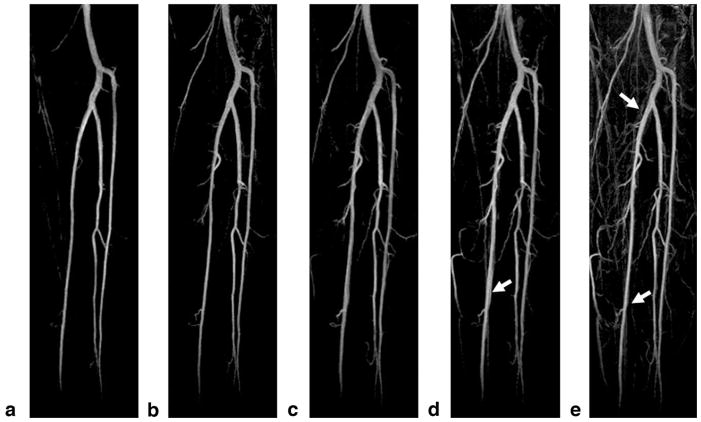
FIG. 7.
Representative subtraction MIP images from a healthy subject obtained using the proposed NC-MRA technique with the FSD gradient duration δ = 1.2 ms and strength G = 5 mT/m (a), 10 mT/m (b), 15 mT/m (c), 20 mT/m (d), and 25 mT/m (e), respectively. At low FSD gradient strengths, major branches of the calf arteries are well depicted, with sufficiently clean background. As the FSD gradient strength increases from 5 to 25 mT/m, more and more sub-branches of the arteries become visible, and on the other hand, more veins and background signals also appear, contaminating artery delineation on MIPs (arrows). All images are displayed with the same window level.

