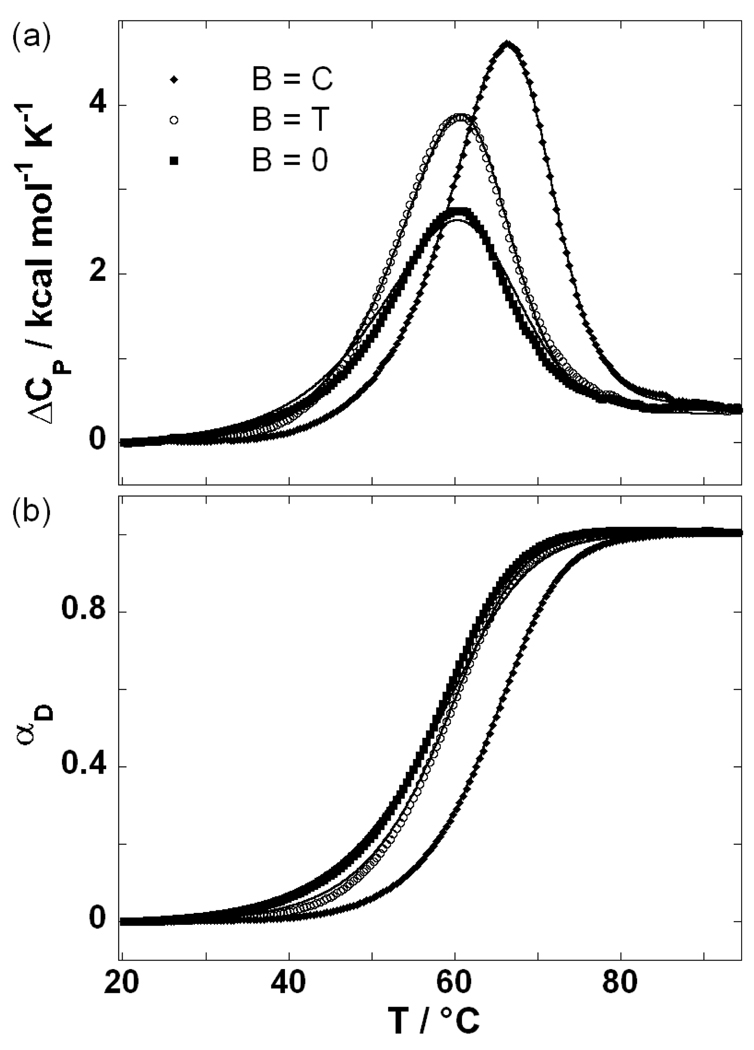
Figure 4.
Experimentally monitored helix-to-coil transitions of the oligonucleotides (B = C, T, 0).
Panel a: DSC thermograms (symbols; every fourth experimental point) and the best fits of the model function (lines; see equation 3). The thermodynamic parameters characterizing the transitions monitored by DSC are presented for B = C, T and 0, respectively: Tm (°C) = 64.4, 58.6, 57.6; ΔHD,Tm (kcal mol−1) = 76.1(+0.1), 67.2(+1.2), 47.7(+6.4); ΔCP,D (kcal mol−1 K−1) = 0.43(+0.02), 0.41(+0.00), 0.44(−0.10). The values in the round brackets are the differences between the model-dependent (equation 3) and the presented model-independent thermodynamic parameters.
Panel b: Fraction of the oligonuceotides in the denatured state, αD, calculated either directly from DSC thermograms (Panel a) as a model-independent ΔH/ΔHD ratio (symbols; ΔH was obtained by integration of experimental ΔCP from the reference temperature at which all DNA molecules exist in the initial (duplex) macrostate (αD = 0) to a given T at which a certain fraction of DNA molecules exist in the final denatured (single-stranded) macrostate; ΔHD was calculated as ΔHD = ΔHD,Tm + ΔCP,D(T – Tm), see experimental materials and methods) or as the model-dependent quantity obtained from the best fit model parameters (lines).

