Figure 2.
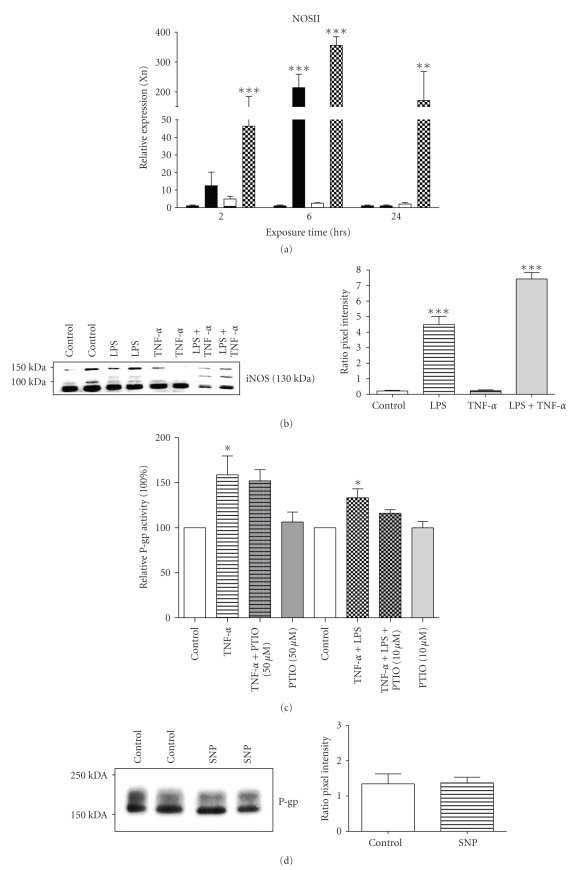
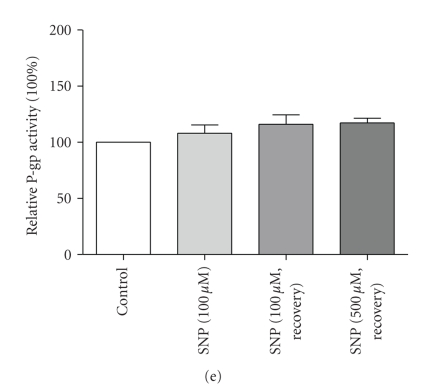
Expression of iNOS and effect of NO on Abcb1/P-gp activity in GERP cells. ((a) n = 4) NOSII expression in GERP cells after exposure to either 10 μg/mL LPS (closed bars), 10 ng/mL TNF-α (striped bars) or both 10 μg/mL LPS and 10 ng/mL TNF-α (chequered bars) for 2, 6 or 24 hours (n = 4). mRNA levels were determined with RQ-PCR and expression was normalized for the GAPDH CT value. ((b) n = 4) iNOS protein expression in GERP cells (control; lanes 1 and 2) after exposure to either 10 μg/mL LPS (lanes 3 and 4), 10 ng/mL TNF-α (lanes 5 and 6) or both 10 μg/mL LPS and 10 ng/mL TNF-α (lanes 7 and 8) for 6 hours. ((c) n = 3–5) P-gp transport activity in GERP cells after exposure to 10 ng/mL TNF-α or both 10 μg/mL LPS and 10 ng/mL TNF-α in combination with 50 or 10 μM of the NO-scavenger PTIO, respectively, for 24 hours compared to control (cells exposed to culture medium). ((d) n = 4) P-gp protein expression in GERP cells (control; lanes 1 and 2) after exposure to 100 μM SNP (lanes 3 and 4) for 1 hour with 5 hours recovery. ((e) n = 4) P-gp transport activity in GERP cells, compared control, after exposure to 100 or 500 μM SNP for 6 hours or for 1 hour with a subsequent recovery period of 5 hours. Total cell fractions of GERP cells were used and expression of iNOS (b) or P-gp (d) was determined by Western blotting. Relative pixel intensities (ratio iNOS/β-actin (b) and ratio P-gp/β-actin (d)) were determined through image analysis. Data are expressed as mean ± SEM. Significantly different compared to control (*: P < .05, **; P < .01, ***: P < .001).


