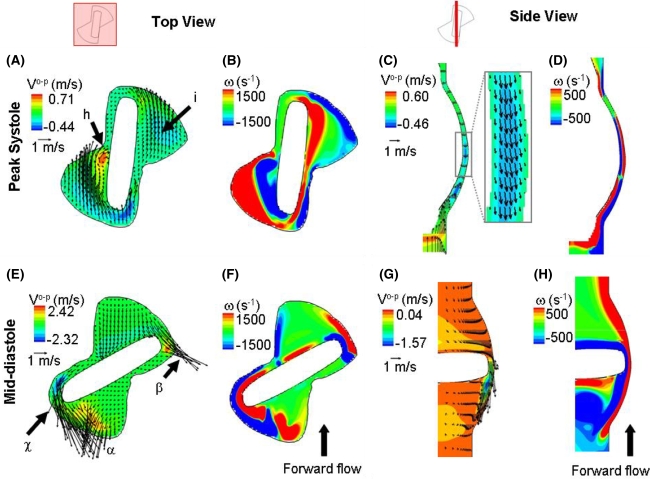
Figure 4.
Hinge flow fields at peak systole and mid-diastole. As depicted on the two hinge diagrams, the top view shows the flow fields at the flat level while the side view shows the flow fields along a cross-sectional plane located in the center of the hinge. Two dimensional in-plane velocity vectors along with out-of-plane velocity component (V o-p) contours and out-of-plane vorticity (ω) contour plots are shown at peak systole (top row) and diastole (bottom row). The out-of-plane component corresponds to the vertical component in panels A, B, E and F and to the radial component in panels C, D, G and H

