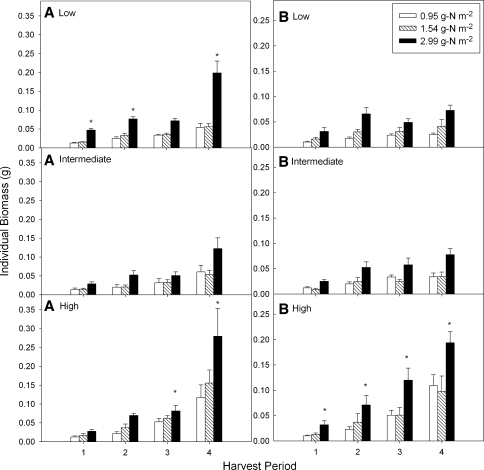
Fig. 2.
Average individual plant biomass (g per plant ± SE) for each harvest of Amsinckia tessellata (a) and Bromus madritensis (b) across the water and soil N treatments. At the end of the growing season the largest individuals were found in the high water, high-N (black bars) treatments. Asterisks indicate the most significant response

