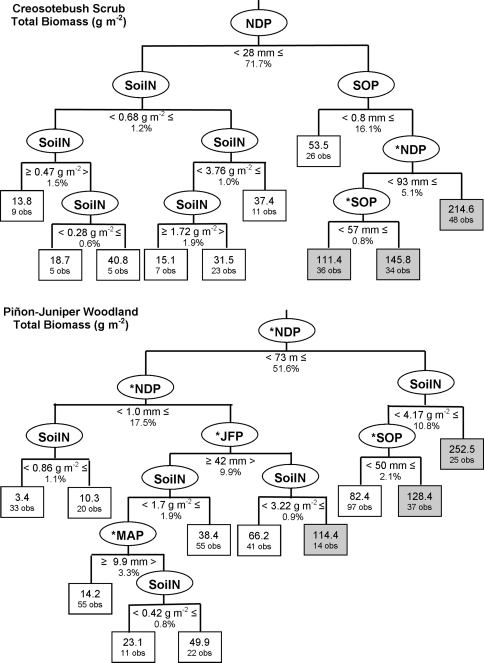
Fig. 3.
Regression tree results on total biomass for each vegetation type. Predictor variables (see Table 2) in ovals, threshold value and percentage of model variance explained by that variable under the oval. Mean value of the response variable in rectangles, number of observations falling within that class shown under the mean. Biomass above the fire-carrying threshold indicated by shading. Asterisks indicate when multiple variables explained equal SS

