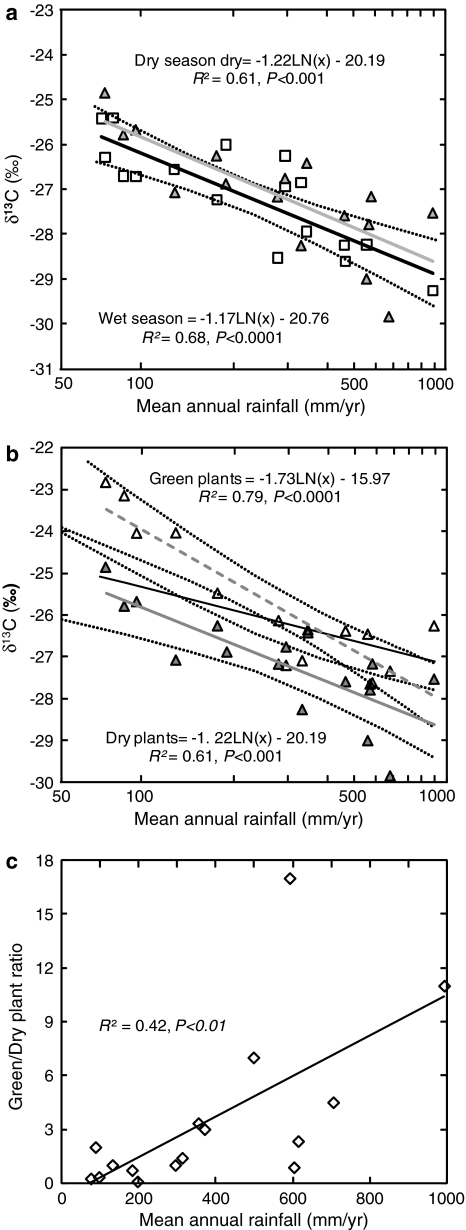
Fig. 3.
Contribution of dry and green plants to the relationship between δ13C values of dry season plants and rainfall. a Dry season, C isotope site means of dried plants indicated by triangles, gray regression line; wet season site means indicated by squares, solid regression line with 95% confidence intervals indicate by dotted lines (dry wash sites not included in regression analysis). b Dry season site mean regression line indicated by bold solid line is compared to the regression of green (open triangles, hatched regression line) and dry plants (closed triangles, dotted regression line) with 95% confidence intervals (dry wash sites not included in regression analysis). c Correlation between green/dry plants ratio per site (number of species from each group) during dry season and mean annual rainfall

