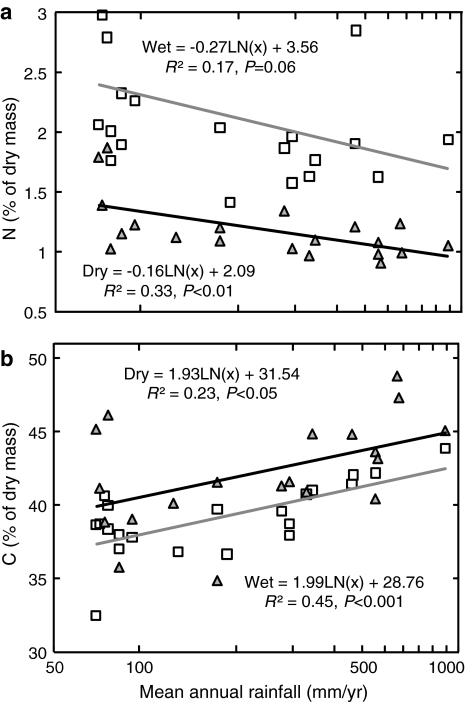
Fig. 5.
Seasonal trends and correlation between site means of %N (a) and %C (b) and rainfall. Dry season sites indicated by gray triangles, dashed regression line; wet season sites indicated by empty squares, solid regression line. The difference between seasons is significant (t test, %N P < 0.0001; %C P < 0.01)

