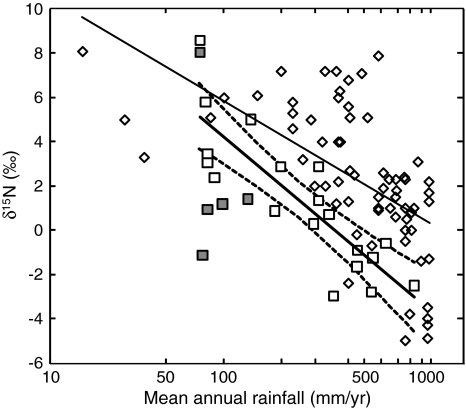
Fig. 8.
Global and local trends in the relationship between rainfall and the N isotopes of C3 plants. Local relationship between rainfall and the annual δ15N values of C3 plant sites (open squares), represented by linear regression line (thick black line) with 95% confidence intervals (dashed lines). Exposed ridge desert plant sites are indicated by gray squares. Regression line (thin black line) showing the global relationship between rainfall and the δ15N values of C3 plant sites (open diamonds) n = 68, y = −2.22x + 16.07, R 2 = 0.36, P < 0.0001 (data taken from Handley et al. 1999; Swap et al. 2004)

