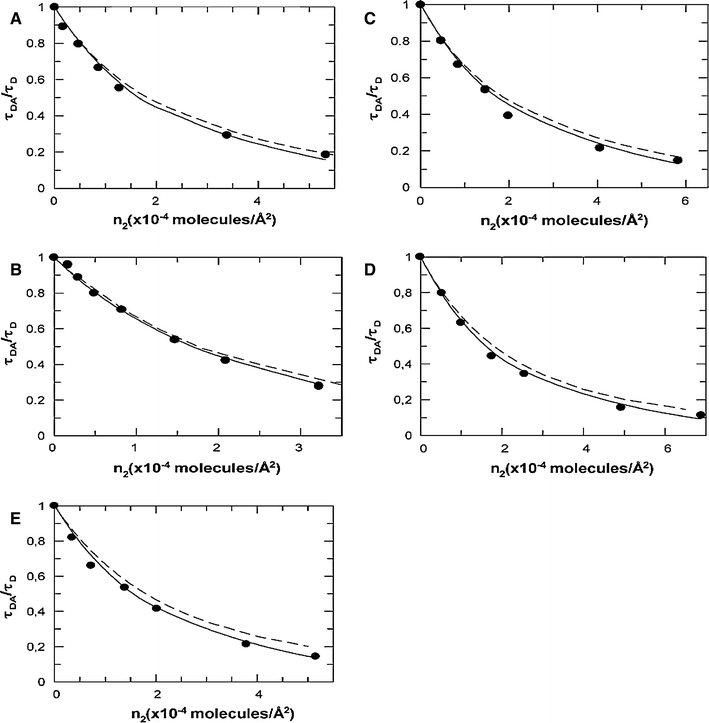
Fig. 4.

DCIA-labeled M13 MCP fluorescence quenching by energy transfer acceptor (18:1-(12:0-NBD)-PX), where “X” stands for the different headgroup structures, in pure bilayers of di18:1-PC. n 2 is the acceptor density for the whole bilayer. Continuous line shows theoretical simulations obtained from the annular model for protein–lipid interaction using the fitted K S; Dashed line shows simulations for random distribution of acceptors (K S = 1.0). (a) PC-labeled phospholipid (fitted K S = 2.0); (b) PE-labeled phospholipid (fitted K S = 2.0); (c) PG-labeled phospholipid (fitted K S = 2.3); (d) PS-labeled phospholipid (fitted K S = 2.7); and (e) PA-labeled phospholipid (fitted K S = 3). Reprinted with permission from Fernandes et al. (2004); copyright 2004, Biophysical Society
