Abstract
The electric properties (EPs) of biological tissue, i.e., the electric conductivity and permittivity, can provide important information in the diagnosis of various diseases. The EPs also play an important role in specific absorption rate (SAR) calculation, a major concern in high-field Magnetic Resonance Imaging (MRI), as well as in non-medical areas such as wireless-telecommunications. The high-field MRI system is accompanied by significant wave propagation effects, and the radio frequency (RF) radiation is dependent on the EPs of biological tissue. Based on the measurement of the active transverse magnetic component of the applied RF field (known as B1-mapping technique), we propose a dual-excitation algorithm, which uses two sets of measured B1 data to noninvasively reconstruct the electric properties of biological tissues. The Finite Element Method (FEM) was utilized in three-dimensional (3D) modeling and B1 field calculation. A series of computer simulations were conducted to evaluate the feasibility and performance of the proposed method on a 3D head model within a transverse electromagnetic (TEM) coil and a birdcage (BC) coil. Using a TEM coil, when noise free, the reconstructed EP distribution of tissues in the brain has relative errors of 12% ∼ 28% and correlated coefficients of greater than 0.91. Compared with other B1-mapping based reconstruction algorithms, our approach provides superior performance without the need for iterative computations. The present simulation results suggest that good reconstruction of electric properties from B1 mapping can be achieved.
Index Terms: electric properties, B1-mapping, Magnetic Resonance Electric Properties Tomography (MREPT), electrical impedance imaging
I. Introduction
The electric properties (EPs; conductivity σ and permittivity εr) of biological tissues at radio and microwave frequencies have been the subject of research for over four decades [1]. A comprehensive survey to date was conducted by Gabriel et al. [2-4], which covered a large selection of healthy tissue over a wide spectrum of frequencies (10Hz-20GHz). A few studies have also been conducted on EPs of a variety of cancerous tissue types at radio and microwave frequencies [5],[6],[7]. These studies have consistently shown that the EPs of cancerous tissues are three or more times greater than those of healthy tissue, and so it is anticipated that such EP information could be used in cancer detection. In addition, EPs are a determinant factor for the specific absorption rate (SAR), which is a major concern of safety in high-field Magnetic Resonance Imaging (MRI) systems and a critical problem in non-medical areas such as wireless-telecommunications.
In the past two decades, many efforts have been made to produce cross-sectional images of EPs in vivo by means of Electrical Impedance Tomography (EIT) [8-10] and its variants using magnetic induction (MIT) [11]. Both EIT and MIT are cost-effective and can provide dynamic information in regard to tissue EPs, but they are limited by low spatial resolution due to the surface measurements and the need to solve an ill-posed inverse problem. A technique called “Magnetic Resonance Electrical Impedance Tomography (MREIT)”, which is based on the Magnetic Resonance Current Density Imaging (MRCDI) technique [12] and measures current injection inducted MR phase shifts, has been pursued [13-16]. While MREIT eliminates the need to solve the ill-posed inverse problem and provides high spatial resolution in imaging electrical conductivity in vivo, it requires current injection into the body within an MRI scanner, which limits its applicability in medical applications. Another recently developed approach, Magnetoacoustic Tomography with Magnetic Induction (MAT-MI), offers the promise of obtaining high resolution tissue electrical conductivity profiles [17-20]. In MAT-MI, an object is placed in a static magnetic field and a pulsed magnetic field is applied to induce acoustic signals, which are then detected to reconstruct the tissue conductivity distribution. However, there have been no in vivo experiments reported so far.
Haacke et al. proposed a method of extracting EPs from MRI images [21]. They found that in 1.5T (and above) MRI systems, the wavelength of the radio frequency (RF) radiation was of the order of the body size, leading to a distortion of the RF field inside the irradiated object. By using an iterative sensitivity-matrix algorithm, these authors suggested that the EPs can be estimated using MRI images that reflect the disrupted RF profile. Wen later pointed out that the perturbation of the RF field in high-field MRI directly related to the conductivity and permittivity distribution within the sample, and a modified Helmholtz equation based non-iterative algorithm was proposed and tested in phantom experiments using 1.5T and 4.7T MRI [22]. Recently, using an iterative algorithm derived from Ampere's Law, Katscher et al. conducted an in vivo experiment using a 3T MRI system to image the EPs within a human head and leg [23], and named this approach “Magnetic Resonance Electric Properties Tomography (MREPT)”.
Signal intensity (SI) nonuniformity is distinct in high-field MRI systems. It can arise from a variety of factors, including imperfections in the scanner hardware and interactions between the magnetic field and biological tissues. Among these factors, electromagnetic (EM) interactions with the object have been shown to be the primary cause of SI nonuniformity for volume coils. It was reported that in 1.5T MRI systems, loaded birdcage (BC) coils had in-plane uniformity with 20% variation compared with as little as 1% variation when unloaded [24]. Through a series of experimental and simulation studies, it has been shown that the magnetic field distribution in the transverse plane of the coil is strongly dependent on the EPs of the biological tissues being studied [25]; moreover, the magnetic field distribution inside the RF coil at a high field can be studied and explained using Maxwell equations [26,27]. These findings have provided us with the mathematical framework to link EP distribution with MRI images.
The B1-mapping technique [28-30] was developed to measure the rotating RF field components: the transmitted and received fields in RF coils. With the principle of reciprocity [31], the Cartesian transverse components of the RF magnetic field, Hx and Hy, can be derived. MREPT utilizes these two measurements to reconstruct the EP values within biological tissues, differing from other noninvasive imaging techniques in that no electrode mounting is required and no external energy is introduced into the body during MRI scanning. It can be performed using a standard MRI system with a regular volume coil, and its spatial resolution is determined by MRI images and the quality of the applied B1-mapping technique [23].
In the present study, a new non-iterative dual-excitation MREPT algorithm to image the tissue EPs is proposed, and the finite element method (FEM) [32] is utilized in RF coil modeling and B1 field calculation. The performance of the proposed MREPT algorithm is evaluated using a five-tissue 3D anatomically accurate head model, a shielded 12-rung birdcage, and a transverse electromagnetic (TEM) coil.
II. Dual-excitation MREPT approach
A. Computation in high-frequency time-harmonic EM field – the forward problem
The RF field excited in MRI coils can be treated as a time-harmonic EM field [27]. Assuming the object of interest to be isotropic, and using the generalized Ampere circuit law and Faraday's magnetic induction law in a time-harmonic EM field, Helmholtz equation can be derived as [33]
| (1) |
where E is the electric field vector, Js the excitation current density in the coil, μ0 the free space permeability, μr the relative permeability, ω the operating angular frequency, k0 the vacuum wave number defined by with ε0 as the free space permittivity, and εc the complex permittivity εc = εrε0 − jσ/ω with εr as the relative permittivity. Using the results of the electric field vector E, the magnetic field strength H can be obtained from [33]
| (2) |
The finite element method is normally used to solve electromagnetic problems, and with its flexibility in grid size, FEM can deal with objects having irregular geometries with good accuracy. In the present study, all EM fields were calculated through (1) and (2) by means of FEM using ANSYS 11.0 (ANSYS, Inc., PA, USA) software with its “high-frequency harmonic EM analysis”, whereas the postprocessing of EM field data was completed using MATLAB 2008a (The Mathworks Inc., Natick, MA).
The B1-mapping technique measures rotating RF field components: the transmitted and received field in RF coils. The principle of reciprocity [31] links magnetic field components in Cartesian and rotating frames via
| (3) |
where Hx and Hy are the x and y oriented RF magnetic fields created by the coil. We use (2) to derive these transverse magnetic components, and MREPT utilizes these two measurements to reconstruct the EP values of biological tissues.
B. Dual-excitation algorithm – the inverse problem
Consider the magnetic permeability inside biological tissues to be equal to that in a vacuum. Ampere's Law reads
| (4) |
Using the complex permittivity εc = εrε0 − jσ/ω, we have
| (5) |
Taking the curl of both sides of (5) and substituting with ∇ × E = − jωμ0H, we get
| (6) |
or its matrix form
| (7) |
According to Ampere's Law, we replace the electric field components with magnetic field components as follows
| (8) |
For regular birdcage coils, the axial z component of the end-ring generated magnetic field (Hz) is nonproductive for NMR excitation, and can become a source of ohmic loss to induced conduction currents in the tissue load conductor. To solve this problem, the TEM resonator was developed [34], in which the coil's return path follows the shield rather than the end rings, and a rung-current-generated transverse magnetic field without the counterproductive end-ring currents is achieved. In this case, we can neglect the Hz component in (8), and rewrite (7) as
| (9) |
In (9), Hx and Hy distributions correspond to B1-mapping results, while εc, (∂εc/∂x)/εc, (∂εc/∂y)/εc and (∂εc/∂z)/εc are unknown. Upon acquiring another set of Hx ∼ Hy data, we can form a set of linear equations with four equations and four unknown variables, and thus εc can be solved.
Two methods can be adopted to acquire two sets of Hx ∼ Hy data: (a) adjusting the RF coil excitation modes, such as linear (vertical and/or horizontal polarization) and/or quadrature modes [35], to excite the imaging object twice, separately, but with the same subject orientation; or (b) rotating the subject along the z-axis by an angle. In the present study, we used the linear excitation mode to generate two polarizations by switching the current feed points to positions 90 degrees apart from each other.
III. Materials and Methods
A. FEM Model of the Head and Coil
T1-weighted MRI images (128×128×72, 2×2×2mm3) of a human head, which covered the entire brain, were acquired from a 3T Siemens MRI system. The head images were then segmented into five tissues: scalp, skull, CSF, WM and GM. The structural information was imported into ANSYS software, and a five-tissue anatomically accurate head model was constructed using a hexahedral element with a mesh size of 2×2×2mm3, which is equivalent to the voxel size of MRI images.
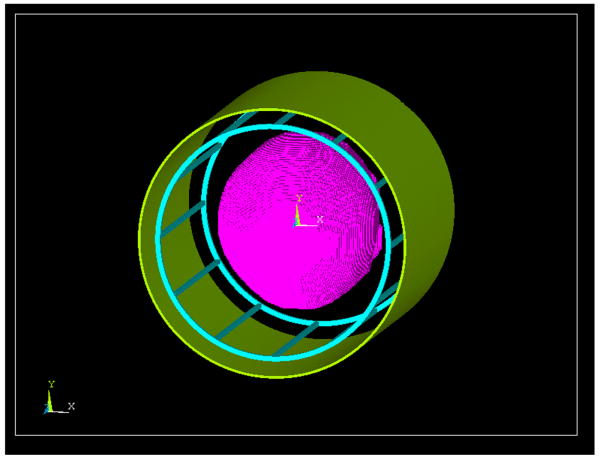
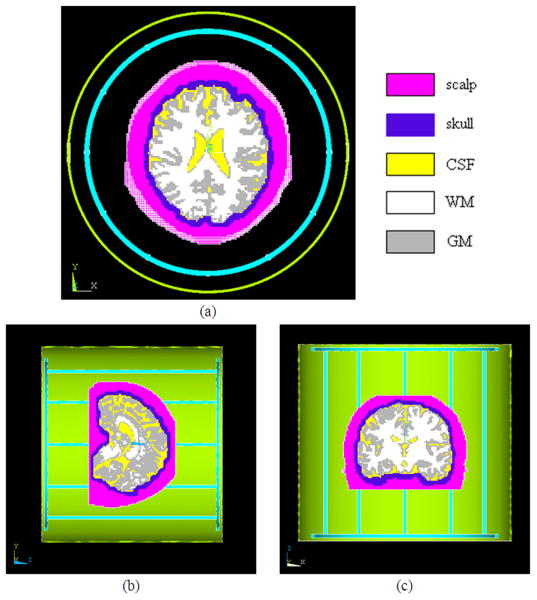
A 12-rung birdcage coil and a TEM coil with diameters of 28cm and lengths of 28cm were modeled. Either coil was enclosed by a cylindrical shield having a diameter of 32cm and a length of 30cm. Both the coils and the shield(s) were meshed with the tetrahedral element and assigned with copper material. Fig. 1 illustrates the FEM models of the head and shielded birdcage coil in ANSYS, and Fig. 2 shows the structural views on the axial, sagittal and coronal planes.
Fig. 1.
Overview of the head FEM model and a 12-rung shielded birdcage coil FEM model (green: copper shield, cyan: rungs and end-rings, magenta: head)
Fig. 2.
Axial (a), sagittal (b) and coronal (c) views of the FEM models. The head model was meshed with hexahedral element while the coil with tetrahedral element.
Since all RF coils are basically open structures, the field generated by a coil radiates into a large space. However, a numerical simulation can be performed only inside a finite space. Therefore, we must first truncate the simulation space by using an air volume to enclose the solution area. In order to reduce the artificial field reflection produced by the volume, we used a Perfectly Matched Layer (PML) [36] to surround the artificial surface of the air volume. For our shielded coils, the shield provided the truncation at which the boundary condition n̂ × E = 0 should be applied [35]. Both air and PML volumes were discretized with the tetrahedral element.
B. Coil Excitation
To perform a linear excitation, the equivalent circuit model [35] was utilized to calculate the electric current in each rung. All of the capacitors in the coil were replaced with current sources at the required resonant frequency. For the birdcage coil, the current flowing in the ith rung is
| (10) |
where I0 denotes the maximum current. In our study, I0 was assumed to be unit current, so the current flowing in the end-rings between the ith and (i+1)th rungs is
| (11) |
For the TEM coil, the current in each end-ring was assigned to be zero. Similar current configurations can also be found in [37].
π/2 and π/6 offset was added on the phase of the current flowing in the coil, separately, to simulate the current feed point switching. Three coil excitation schemes are listed in TABLE I.
Table I.
Specifications of Coil Excitation Schemes
| current in the ith rung | current feed point | generated magnetic field | ||
|---|---|---|---|---|
| Scheme 1 (S1) |
|
-- | and | |
| Scheme 2 (S2) |
|
90° apart from that of scheme 1 | and | |
| Scheme 3 (S3) |
|
30° apart from that of scheme 1 | and |
C. Simulation Protocols
Simulations were conducted in 3T (128MHz) environment. The corresponding target EP values for different head tissues were derived from the 4-Cole-Cole Model [4] and are listed in Table II.
Table II.
EP Values of Head Tissues
| Human head | σ (S/m) | εr |
|---|---|---|
| Scalp | 0.54 | 62 |
| Skull | 0.12 | 21 |
| CSF | 2.14 | 84 |
| White Matter | 0.34 | 52 |
| Gray Matter | 0.59 | 73 |
Using ANSYS software as the forward solver, we generated the simulated data of Hx and Hy by different coil excitation schemes, correspondingly. Simulations were conducted on both the birdcage coil and TEM coil to evaluate the influence of neglecting the Hz component in (9).
We define relative error (RE) and correlation coefficient (CC) of the reconstructed EPs images as
| (12) |
where σtissue and εtissue are the target EP values, and and are the estimated values in the ith pixels within the specified tissue.
In order to test the noise tolerance of the proposed algorithm, we added Gaussian white noise (GWN) to the simulated B1 field data. From (3) we get the circularly-polarized components of the B1 field, then add GWN to the amplitude and phase of and , respectively. The noise level is evaluated by SNRB1, which is defined as follows
| (13) |
where A is the amplitude of the noise-free B1 field voxel signal and samp is the standard deviation (STD) of amplitude noise. In the present study, we assumed SNRB1=200, 150 and 100. Note that here, SNRB1 is different from the commonly denoted SNR of MRI systems (SNRMRI). A related description can be found in the Discussion and Appendix.
The Wiener adaptive lowpass-filter was applied to pre-process the “contaminated” B1 maps, and (3) was re-used to derive the Hx and Hy components.
IV. Simulation Results
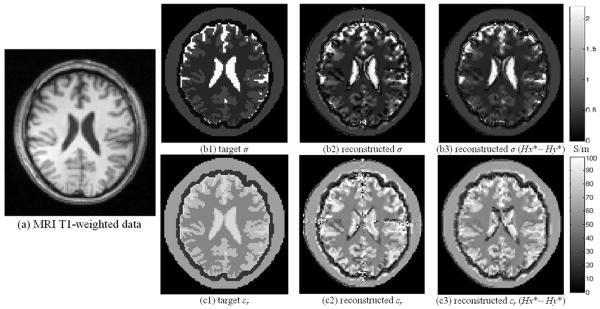
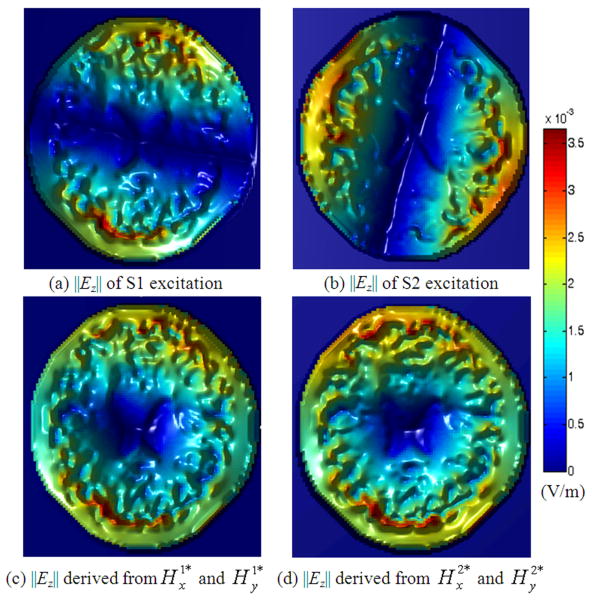
We chose the central slice (z=0) of the head model as the slice of interest, and the corresponding MRI T1-weighted image is depicted in Fig. 3 (a). Figs. 3 (b1) and (c1) draw the target EP distributions after image segmentation. Using the 28cm-long TEM coil, with and data acquired from coil excitation schemes S1 and S2, the reconstructed EP distributions are shown in (b2) and (c2). Two bright stripe-like artifacts along the x- and y-axes are observed in above results, and this phenomenon resulted from the characteristics of the Ez distribution inside the linearly polarized RF coil. Figs. 4 (a) and (b) depict the modulus of the Ez distribution on the central axial slice within the head using S1 and S2 excitations, in which the Ez modulus varied rapidly and dropped to zero in the area across the x-axis in (a) and the y-axis in (b). We define DH = (∂Hy/∂x − ∂Hx/∂y), and DH has the same modulus distribution with Ez according to (8). Since DH acts as a denominator in our algorithm as (9) indicates, its “zero” area would introduce numerical errors, which are observed in the reconstruction results in Fig. 3 as two bright stripe-like artifacts.
Fig. 3.
MRI T1-weighted image (a) of the slice of interest, segmented target EP distributions (b1) &. (c1), reconstructed EP distributions (b2) &. (c2), and reconstructed EP distribution (b3) &. (c3) using Hx ∼ Hy data when noise free. Using the 28cm-long TEM coil, coil excitation schemes S1 and S2 were applied. Two bright stripe-like artifacts along x- and y-axes can be observed in (b2) and (c2).
Fig. 4.
‖Ez‖ distribution with the TEM coil when noise-free. Coil excitation schemes S1 and S2 were applied. (a) and (b) depict ‖Ez‖ distribution for each excitation scheme, and (c) and (d) show the ‖Ez‖ distribution corresponding to our newly produced B1 field. Much lower intensity can be observed along x- and y-axes in (a) and (b), and in the central area in (c) and (d).
To solve the above problem, we produced two new sets of data by
| (14) |
In a linear medium, the system described by Maxwell's equations is a linear system; according to the superposition principle, and still hold for (9). Figs. 4 (c) and (d) show the ‖Ez‖ distribution corresponding to the new data, and Figs. 3 (b3) and (c3) show the reconstructed EP results using data when noise-free. The bright stripe-like artifacts disappear in the reconstructed images; however, there are still little artifacts in the reconstructed images, and they mainly resulted from much lower intensity of the ‖Ez‖ distribution in the central area, as Figs. 4 (c) and (d) depict, which is about 1/100 of the periphery intensity. Reconstruction results for CSF, WM and GM tissues are listed in TABLE III, and their relative errors range within 12% ∼ 28% while correlated coefficients all above 0.91. Similar data processing have been applied in the following simulations.
Table III.
Relative Errors and Correlation Coefficients of Reconstructed Electric Properties without and With HZ Component Using Tem and Birdcage Coils
| REs / CCs | 28cm TEM without HZ | 28cm BC without HZ | 28cm BC with HZ | 12cm BC without HZ | |||||
|---|---|---|---|---|---|---|---|---|---|
| CSF | σ | 27.1% | 0.971 | 30.1% | 0.899 | 28.2% | 0.943 | 39.4% | 0.8525 |
| εr | 24.9% | 0.936 | 26.3% | 0.902 | 24.3% | 0.920 | 38.1% | 0.8908 | |
| WM | σ | 21.4% | 0.940 | 28.6% | 0.898 | 25.1% | 0.908 | 38.9% | 0.8430 |
| εr | 12.7% | 0.982 | 15.3% | 0.963 | 12.6% | 0.987 | 28.6% | 0.9258 | |
| GM | σ | 28.6% | 0.913 | 32.2% | 0.888 | 27.7% | 0.919 | 40.6% | 0.8513 |
| εr | 18.0% | 0.969 | 18.8% | 0.958 | 16.5% | 0.974 | 39.1% | 0.8585 | |
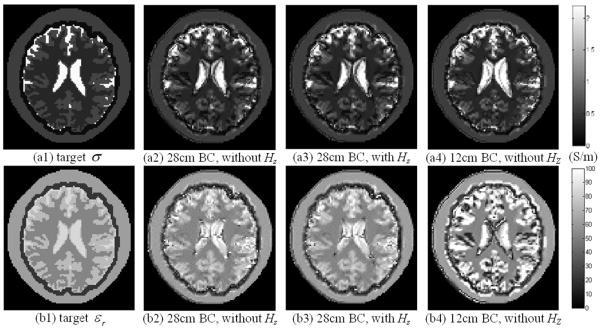
In our algorithm, ∂Hz/∂y and ∂Hz/∂x are assumed to be negligible. Since birdcage coils have been widely used in clinical applications, it is necessary to evaluate the HZ effects for regular birdcage coils. We applied the dual-excitation algorithm on the 28cm-long birdcage, and we also took ∂Hz/∂y and ∂Hz/∂x into equation (9) to finish the reconstruction using the same coil. In addition, we constructed a 12cm-long birdcage coil (with the same other geometrical parameters and configurations as the 28cm-long birdcage coil) to evaluate its performance. Coil excitation schemes S1 and S2 were applied. Reconstructed EPs distribution and simulation results are shown and summarized in Fig. 5 and TABLE III, respectively. It can be observed that, when HZ component was considered we could surely improve EPs reconstruction results. However, while the experimental measurement of HZ component is not feasible in MRI, it is also reasonable to assume HZ = 0 within a common birdcage coil which could also provide well-differentiated structural information of biological tissues.
Fig. 5.
Reconstructed electric property distribution within a 28cm-long and a 12cm-long birdcage coil. Upper row: conductivity, bottom row: relative permittivity. From left to right: target EP distribution, reconstruction results without and with HZ component in the birdcage coils, respectively.
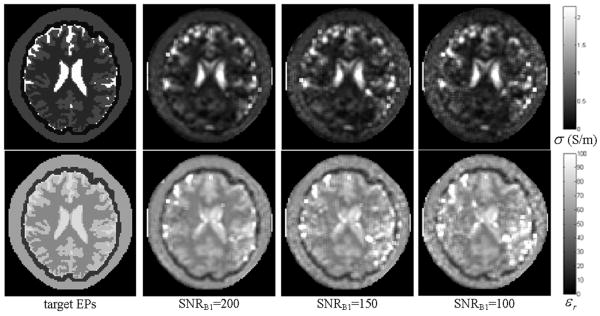
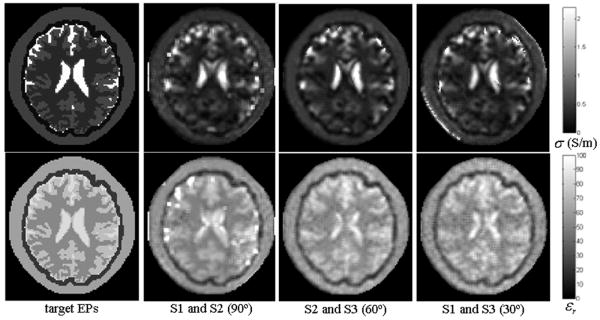
Fig. 6 shows the reconstructed EPs distribution when noise was added with SNRB1=200, 150 and 100. The corresponding REs and CCs are summarized in TABLE IV. The 28cm-long TEM coil and S1 and S2 coil excitations were used. We also applied S2 and S3, S1 and S3 -- choosing two adjacent rungs as current feed points individually -- to excite the TEM coil with noise (SNRB1=200). A comparison of the reconstruction results is depicted in Fig. 7. It can be observed that, when added with noise, all the tissues could be differentiated in the reconstruction results; and similar tissue patterns could also be produced while different coil excitation scheme combinations were utilized.
Fig. 6.
Reconstructed electric property distribution within a 28cm-long TEM coil. Upper row: conductivity, bottom row: relative permittivity. From left to right: target EP distribution, reconstruction results with decreasing SNRB1.
Table IV.
Relative Errors and Correlation Coefficients of Reconstructed Electric Property Distribution with Decreasing SNRB1.
| REs / CCs | SNRB1=200 | SNRB1=150 | SNRB1=100 | ||||
|---|---|---|---|---|---|---|---|
| CSF | σ | 46.4% | 0.690 | 50.1% | 0.679 | 67.1% | 0.657 |
| εr | 28.6% | 0.751 | 34.4% | 0.701 | 56.8% | 0.659 | |
| WM | σ | 39.1% | 0.788 | 53.2% | 0.749 | 74.4% | 0.735 |
| εr | 27.4% | 0.901 | 33.8% | 0.874 | 45.1% | 0.821 | |
| GM | σ | 49.1% | 0.761 | 60.2% | 0.732 | 74.1% | 0.714 |
| εr | 24.6% | 0.861 | 40.9% | 0.852 | 46.2% | 0.811 | |
Fig. 7.
Reconstructed electric property distribution with different coil excitation scheme combinations. Upper row: conductivity, bottom row: relative permittivity. From left to right: target EP distribution and reconstructed distribution with different phase offset of the current flowing in the coil.
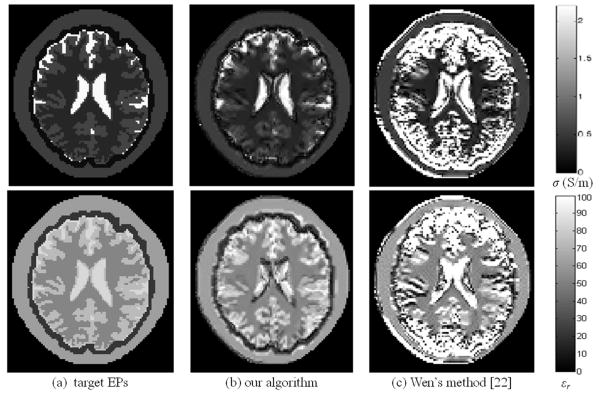
We also applied Wen's method in [22] to the TEM model by S1 and S2 excitations to reconstruct the EPs distribution. Fig. 8 shows the comparison of the reconstruction results when noise-free. It can be seen that we obtained better results around the tissue boundary regions, and this is because the term of jω(∇εc) × E of (6) was not taken into account in the modified Helmholtz equation in Wen's method.
Fig. 8.
Reconstructed electric property distribution with the TEM coil when noise-free, and coil excitation schemes S1 and S2 were applied (upper row: σ distribution, bottom row: εr distribution; from left to right: target EPs, using our algorithm, and using Wen's method [22]).
V. Discussion
Since the conductivity and permittivity values of tissues change with their physiological and pathological conditions, EP maps could provide useful diagnostic information. MREPT promises to reconstruct not only the conductivity distribution, as EIT, MIT, MREIT and MAT-MI aim to do, but also the permittivity distribution within biological tissues, thus enriching our observations of their conditions. In addition, as it is based on B1-mapping, which has been developed and pursued for decades, MREPT does not require electrode mounting or external energy deposition, which pose potential safety concerns. It could provide a high spatial resolution in imaging EPs with the aid of MRI. In the present study, we have proposed a new dual-excitation MREPT algorithm, and as our simulation results indicate, the dual-excitation algorithm furnishes us with a practical approach to reconstructing the conductivity and permittivity distributions within a human head while avoiding the need to solve the ill-posed inverse problem present in traditional EIT. The desirable reconstruction results of tissues with heavier implications in physiology and pathology (such as CSF, WM and GM) suggest that MREPT imaging deserves further investigation, can be extended to other organs of the human body, and may have wide clinical applications.
In our algorithm, the z component of the magnetic field intensity Hz is neglected. Our simulation results suggest that the dual-excitation algorithm still works well, even using a typical birdcage coils (Fig. 5) in which the Hz component prominently exists and is mainly generated by end-rings. Using a TEM coil, we can get better reconstruction EP images with higher accuracy.
To eliminate the bright stripe-like artifacts in Fig. 2, we produced two new sets of according to the superposition principle. Alternatively, to generate a similar ‖Ez‖ distribution as in Figs. 3 (c) and (d), we may also excite the coil by quadrature polarization which is commonly utilized in commercial RF coils. However, since our algorithm needs to excite the coil twice, at least three current feed points will be required to perform the quadrature excitation twice. Therefore, our approach of using data acquired from two linear excitations appears to be more feasible and easy to implement.
In contrast to the previously proposed MREPT algorithms in [21] and [23], our approach does not require iterative computation which needs precise coil and subject modeling and is time consuming. Compared with the method in [22], ours is more capable to deal with regions where the EPs distribute inhomogeneously and discontinuously. Fig. 8 illustrates this point.
Uniqueness of solution is an important issue in inverse problems. We applied three coil excitation schemes, and conducted the reconstruction procedures by choosing two 30°-apart (adjacent), 60°-apart and 90°-apart current feed points. It is shown in Fig. 7 that, under either excitation combination with noise added, our algorithm works well and produces overall similar distributions of the EPs. While these results suggest robustness and potential uniqueness characteristic of our algorithm, it is also indicated that when the switching current feed point is infeasible, our algorithm is still effective by careful subject rotation over a small angle inside the coil. In the future, the theoretical study on the uniqueness of the MREPT problem remains to be further performed.
In previous B1 field simulation studies, the EP values were preset according to experimentally measured data [39] or the published 4-Cole-Cole dispersion relation [3]. However, in many instances, these two data are not in good agreement. Our algorithm will provide another effective way to accurately predict the EP values of biological tissues, and will also substantially benefit future studies in the MRI domain as well as other areas that involve EP configuration in the range of radio frequency.
For isotropic biological tissues, the SAR is defined by
| (15) |
where ρ is the tissue density and is determined through experimental measurement. Once we get the B1 distribution, the EP values can be obtained from the dual-excitation algorithm. Since Hx and Hy are more dominant in a birdcage and TEM coil, the electric field can be determined by Ampere's Law without Hz component, and we can directly calculate the SAR distribution. Thus, the evaluation of heat effects becomes more convenient.
In our algorithm, the Laplacian operation ∇2H amplifies noise effect. Thus the present algorithm is relatively sensitive to noise, as shown in Table IV when SNR drops. We have applied Wiener filtering over B1 images; in addition, other feasible ways can be used to reduce noise level in experiment, such as taking multi-MRI scans in experiments and average B1 images. Furthermore, for common B1 mapping techniques, the scanning parameters are usually chosen as TR ≫ T1 ≫ TE, and the MRI image signal intensity depends on and via [21, 23, 38]
| (16) |
where M0 is the equilibrium magnetization, γ the gyromagnetic ratio of 1H, and τ the duration of rectangular RF pulse. For small flip angle pulse, (16) can be written as
| (17) |
and image signal intensity is propositional to . When we add noise into and leveled by SNRB1, it can be proved that the corresponding SNRMRI will be lower than SNRB1 (see Appendix); in other words, SNRB1 is times higher than SNRMRI. Moreover, note that we only consider noise in the B1 field in such a case; since there are other noise sources in the MRI signal detection process, such as thermal fluctuation and electronics factors, SNRB1 is even higher than SNRMRI. Therefore, our assumption that SNRB1 equals to 100 ∼ 200 is reasonable for regular MRI scanning.
A multi-port quadrature coil can be driven at each one point by well-controlled RF drive circuit [34], thus it is applicable to acquire different B1 data to finish the reconstruction. Besides, our algorithm requires B1 field measurements. Until now, many B1-mapping techniques have been proposed, and the measurement of B1 field intensity has been well established, while phase measurement has been studied by few groups [22, 23, 40]. Recently, a novel B1 phase mapping method was developed in local B1 shimming studies for transceiver arrays [41], and it provides us with the possibility for accurate B1 phase mapping. In the future, more efforts should be focused on the pursuit of B1 complex image mapping in order to improve the efficiency and accuracy of the MREPT technique.
Acknowledgments
We would like to thank Drs. Yiping Du, Zhongmin Liu, Ulrich Katscher, Mr. Xu Li, and Ms. Yang Liu for useful discussions, and Mr. Won Hee Lee for technical assistance in the head FEM modeling. This work was supported in part by NIH R21EB006070, the NNSF of China (50577055), NSF BES-0602957, NIH R01EB007920, and the Supercomputing Institute of the University of Minnesota. X.T. Zhang was partly supported by the Lu's Postgraduate Education International Exchange Fund of Zhejiang University.
Appendix: Derivation of SNRMRI From SNRB1
Noise in B1 field is leveled by SNRB1 in (13) via
| (18) |
where and are noise-free voxel intensity, and s1 and s2 are the STD of two uncorrelated GWN added into and , respectively. We use n1 and n2 to represent these two noise values. Then we have
| (19) |
with the variance as
| (20) |
and the corresponding SNRMRI can be derived from (17) and (20) by
| (21) |
References
- 1.Fear EC, Li X, Hagness SC, Stuchly MA. Confocal microwave imaging for breast cancer detection: localization of tumors in three dimensions. IEEE Trans Biomed Eng. 2002 Aug;49(8):812–22. doi: 10.1109/TBME.2002.800759. [DOI] [PubMed] [Google Scholar]
- 2.Gabriel C, Gabriel S, Corthout E. The dielectric properties of biological tissues .1. Literature survey. Phys Med Biol. 1996 Nov;41(11):2231–2249. doi: 10.1088/0031-9155/41/11/001. [DOI] [PubMed] [Google Scholar]
- 3.Gabriel S, Lau RW, Gabriel C. The dielectric properties of biological tissues: II. Measurements in the frequency range 10 Hz to 20 GHz. Phys Med Biol. 1996 Nov;41(11):2251–69. doi: 10.1088/0031-9155/41/11/002. [DOI] [PubMed] [Google Scholar]
- 4.Gabriel S, Lau RW, Gabriel C. The dielectric properties of biological tissues: III. Parametric models for the dielectric spectrum of tissues. Phys Med Biol. 1996 Nov;41(11):2271–93. doi: 10.1088/0031-9155/41/11/003. [DOI] [PubMed] [Google Scholar]
- 5.Chaudhary SS, Mishra RK, Swarup A, Thomas JM. Dielectric properties of normal & malignant human breast tissues at radiowave & microwave frequencies. Indian J Biochem Biophys. 1984 Feb;21(1):76–9. [PubMed] [Google Scholar]
- 6.Surowiec AJ, Stuchly SS, Barr JB, Swarup A. Dielectric properties of breast carcinoma and the surrounding tissues. IEEE Trans Biomed Eng. 1988 Apr;35(4):257–63. doi: 10.1109/10.1374. [DOI] [PubMed] [Google Scholar]
- 7.Joines WT, Zhang Y, Li C, Jirtle RL. The measured electrical properties of normal and malignant human tissues from 50 to 900 MHz. Med Phys. 1994 Apr;21(4):547–50. doi: 10.1118/1.597312. [DOI] [PubMed] [Google Scholar]
- 8.Kerner TE, Paulsen KD, Hartov A, Soho SK, Poplack SP. Electrical impedance spectroscopy of the breast: clinical imaging results in 26 subjects. IEEE Trans Med Imaging. 2002 Jun;21(6):638–45. doi: 10.1109/tmi.2002.800606. [DOI] [PubMed] [Google Scholar]
- 9.Malich A, Bohm T, Facius M, Freessmeyer M, Fleck M, Anderson R, Kaiser WA. Additional value of electrical impedance scanning: experience of 240 histologically-proven breast lesions. Eur J Cancer. 2001 Dec;37(18):2324–30. doi: 10.1016/s0959-8049(01)00283-0. [DOI] [PubMed] [Google Scholar]
- 10.Metherall P, Barber DC, Smallwood RH, Brown BH. Three-dimensional electrical impedance tomography. Nature. 1996 Apr 11;380(6574):509–12. doi: 10.1038/380509a0. [DOI] [PubMed] [Google Scholar]
- 11.Griffiths H, Stewart WR, Gough W. Magnetic induction tomography. A measuring system for biological tissues. Ann N Y Acad Sci. 1999 Apr 20;873:335–45. doi: 10.1111/j.1749-6632.1999.tb09481.x. [DOI] [PubMed] [Google Scholar]
- 12.Joy M, Scott G, Henkelman M. In vivo detection of applied electric currents by magnetic resonance imaging. Magn Reson Imaging. 1989;7(1):89–94. doi: 10.1016/0730-725x(89)90328-7. [DOI] [PubMed] [Google Scholar]
- 13.Zhang N. MS Thesis. Dept of Elec Eng., Univ Toronto; Toronto, ON, Canada: 1992. Electrical impedance tomography based on current density imaging. [Google Scholar]
- 14.Khang HS, Lee BI, Oh SH, Woo EJ, Lee SY, Cho MY, Kwon O, Yoon JR, Seo JK. J-substitution algorithm in Magnetic Resonance Electrical Impedance Tomography (MREIT): Phantom experiments for static resistivity images. IEEE Trans Med Imaging. 2002 Jun;21(6):695–702. doi: 10.1109/TMI.2002.800604. [DOI] [PubMed] [Google Scholar]
- 15.Ider YZ, Onart S. Algebraic reconstruction for 3D magnetic resonance-electrical impedance tomography (MREIT) using one component of magnetic flux density. Physiol Meas. 2004 Feb;25(1):281–294. doi: 10.1088/0967-3334/25/1/032. [DOI] [PubMed] [Google Scholar]
- 16.Zhang XT, Yan DD, Zhu SA, He B. Noninvasive Imaging of Head-Brain Conductivity Profiles. IEEE Eng Med Biol Mag. 2008;27(5):78–83. doi: 10.1109/MEMB.2008.923953. [DOI] [PMC free article] [PubMed] [Google Scholar]
- 17.Xu Y, He B. Magnetoacoustic tomography with magnetic induction (MAT-MI) Phys Med Biol. 2005;50:5175–5187. doi: 10.1088/0031-9155/50/21/015. [DOI] [PMC free article] [PubMed] [Google Scholar]
- 18.Li X, Xu Y, He B. Imaging Electrical Impedance From Acoustic Measurements by Means of Magnetoacoustic Tomography With Magnetic Induction (MAT-MI) IEEE Trans Biomed Eng. 2007;54(2):323–330. doi: 10.1109/TBME.2006.883827. [DOI] [PubMed] [Google Scholar]
- 19.Xia RM, Li X, He B. Magnetoacoustic tomographic imaging of electrical impedance with magnetic induction. Appl Phys Lett. 2007;91(8):083903. doi: 10.1063/1.2772763. [DOI] [PMC free article] [PubMed] [Google Scholar]
- 20.Xia RM, Li X, He B. Reconstruction of Vectorial Acoustic Sources in Time-Domain Tomography. IEEE Trans Med Imaging. 2009;28(5):669–675. doi: 10.1109/TMI.2008.2008972. [DOI] [PMC free article] [PubMed] [Google Scholar]
- 21.Haacke EM, Petropoulos LS, Nilges EW, Wu DH. Extraction of conductivity and permittivity using magnetic resonance imaging. Phys Med Biol. 1991;38(6):723–734. [Google Scholar]
- 22.Wen H. Noninvasive quantitative mapping of conductivity and dielectric distributions using RF wave propagation effects in high-field MRI. Proc SPIE. 2003;5030:471–477. [Google Scholar]
- 23.Katscher U, Dorniok T, Findeklee C, Vernickel P, Nehrke K. In vivo determination of electric conductivity and permittivity using a standard MR system. In: Scharfetter H, Merwa R, editors. IFMBE Proc. Vol. 17. Berlin, Germany: Springer; 2007. pp. 508–511. [Google Scholar]
- 24.Sled JG, Pike GB. Standing-wave and RF penetration artifacts caused by elliptic geometry: an electrodynamic analysis of MRI. IEEE Trans Med Imaging. 1998;17(4):653–662. doi: 10.1109/42.730409. [DOI] [PubMed] [Google Scholar]
- 25.Alecci M, Collins CM, Smith MB, Jezzard P. Radio frequency magnetic field mapping of a 3 Tesla birdcage coil: Experimental and theoretical dependence on sample properties. Magn Reson Med. 2001;46(2):379–385. doi: 10.1002/mrm.1201. [DOI] [PubMed] [Google Scholar]
- 26.Yang QX, Wang JH, Zhang XL, Collins CM, Smith MB, Liu HY, Zhu XH, Vaughan JT, Ugurbil K, Chen W. Analysis of wave behavior in lossy dielectric samples at high field. Magn Reson Med. 2002;47(5):982–989. doi: 10.1002/mrm.10137. [DOI] [PubMed] [Google Scholar]
- 27.Ibrahim TS, Mitchell C, Abraham R, Schmalbrock P. In-depth study of the electromagnetics of ultrahigh-field MRI. NMR in Biomedicine. 2007 Feb;20(1):58–68. doi: 10.1002/nbm.1094. [DOI] [PubMed] [Google Scholar]
- 28.Akoka S, Franconi F, Seguin F, Lepape A. Radiofrequency Map of an Nmr Coil by Imaging. Magn Reson Imaging. 1993;11(3):437–441. doi: 10.1016/0730-725x(93)90078-r. [DOI] [PubMed] [Google Scholar]
- 29.Insko EK, Bolinger L. Mapping of the Radiofrequency Field. J Mag Res Series A. 1993 Jun 1;103(1):82–85. [Google Scholar]
- 30.Wang JH, Qiu ML, Yang QX, Smith MB, Constable RT. Measurement and correction of transmitter and receiver induced nonuniformities in vivo. Magn Reson Med. 2005 Feb;53(2):408–417. doi: 10.1002/mrm.20354. [DOI] [PubMed] [Google Scholar]
- 31.Hoult DI. The principle of reciprocity in signal strength calculations - A mathematical guide. Conc Mag Res. 2000;12(4):173–187. [Google Scholar]
- 32.Silvester PP, Ferrari RL. Finite Element for Electrical Engineers. Cambridge: Cambridge University Press; 1996. [Google Scholar]
- 33.Kong JA. Electromagnetic Wave Theory. New York: Wiley; 1986. [Google Scholar]
- 34.Vaughan JT, Adriany G, Snyder CJ, Tian J, Thiel T, Bolinger L, Liu H, DelaBarre L, Ugurbil K. Efficient high-frequency body coil for high-field MRI. Magn Reson Med. 2004 Oct;52(4):851–859. doi: 10.1002/mrm.20177. [DOI] [PubMed] [Google Scholar]
- 35.Jin JM. Electromagnetic Analysis and Design in Magnetic Resonance Imaging. New York: CRC Press; 1999. [Google Scholar]
- 36.Berenger JP. A Perfectly Matched Layer for the Absorption of Electromagnetic-Waves. J Comput Phys. 1994 Oct;114(2):185–200. [Google Scholar]
- 37.Reza S, Vijayakumar S, Limkeman M, Huang F, Saylor C. SAR Simulation and the Effect of Mode Coupling in a Birdcage Resonator. Conc Mag Res Part B. 2007;31B(3):133–139. [Google Scholar]
- 38.Haacke EM, Brown PW, Thompson MR, Venkatesan R. Magnetic Resonance Imaging: Physical Principles and Sequence Design. New York: John Wiley and Sons, Inc.; 1999. [Google Scholar]
- 39.Schwan HP. Electrical Properties of Tissue and Cell Suspensions. Adv Biol Med Phys. 1957;5:147–209. doi: 10.1016/b978-1-4832-3111-2.50008-0. [DOI] [PubMed] [Google Scholar]
- 40.Katscher U, Voigt T, Findeklee C. Electrical conductivity imaging using magnetic resonance tomography. Conf. Proc. Annu. Int. Conf. IEEE Eng. Med. Biol. Soc.; Minneapolis. 2009. pp. 3162–3164. [DOI] [PubMed] [Google Scholar]
- 41.Metzger GJ, Snyder C, Akgun C, Vaughan T, Ugurbil K, Van de Moortele PF. Local B-1(+) shimming for prostate imaging with transceiver arrays at 7T based on subject-dependent transmit phase measurements. Magn Reson Med. 2008 Feb;59(2):396–409. doi: 10.1002/mrm.21476. [DOI] [PMC free article] [PubMed] [Google Scholar]


